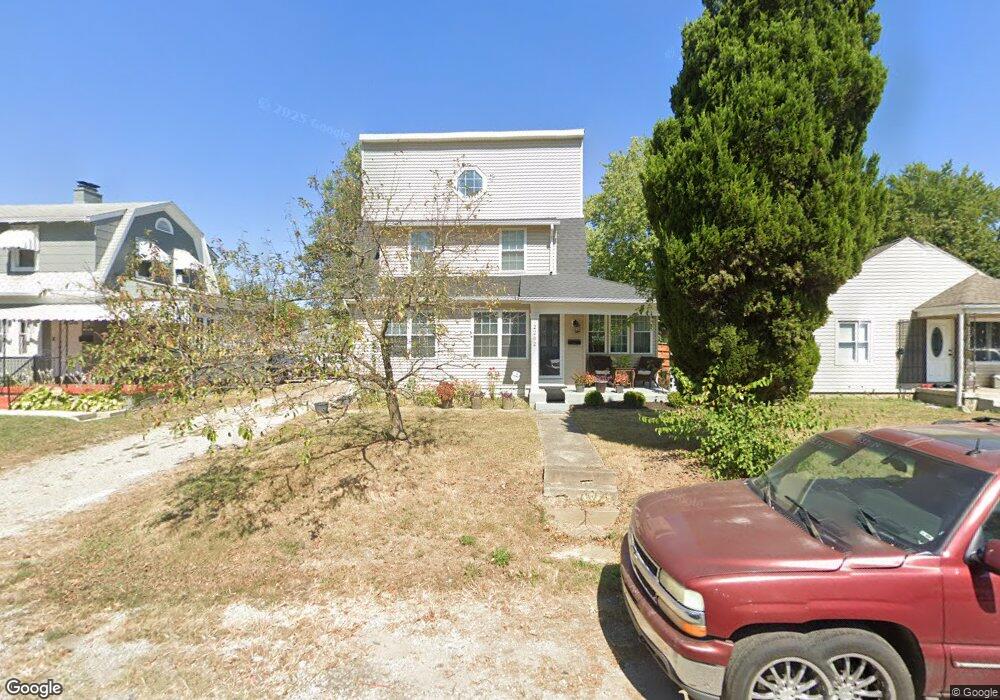
2262 Ferris Rd Columbus, OH 43224
North Linden NeighborhoodEstimated Value: $179,000 - $259,000
3
Beds
2
Baths
1,700
Sq Ft
$138/Sq Ft
Est. Value
About This Home
This home is located at 2262 Ferris Rd, Columbus, OH 43224 and is currently estimated at $234,042, approximately $137 per square foot. 2262 Ferris Rd is a home located in Franklin County with nearby schools including North Linden Elementary School, Medina Middle School, and Mifflin High School.
Ownership History
Date
Name
Owned For
Owner Type
Purchase Details
Closed on
Dec 28, 1999
Sold by
Detterman Douglas K and Detterman Jane
Bought by
Ray Faye M
Current Estimated Value
Home Financials for this Owner
Home Financials are based on the most recent Mortgage that was taken out on this home.
Original Mortgage
$81,050
Outstanding Balance
$25,461
Interest Rate
7.69%
Mortgage Type
FHA
Estimated Equity
$208,581
Purchase Details
Closed on
Mar 6, 1999
Sold by
Detterman Damon K
Bought by
Detterman Douglas K and Detterman Dora Jane
Purchase Details
Closed on
Aug 5, 1996
Sold by
Spencer Shawn F
Bought by
Damon K Betterman
Home Financials for this Owner
Home Financials are based on the most recent Mortgage that was taken out on this home.
Original Mortgage
$60,000
Interest Rate
8.33%
Mortgage Type
New Conventional
Purchase Details
Closed on
Jun 25, 1992
Purchase Details
Closed on
Mar 4, 1992
Create a Home Valuation Report for This Property
The Home Valuation Report is an in-depth analysis detailing your home's value as well as a comparison with similar homes in the area
Home Values in the Area
Average Home Value in this Area
Purchase History
| Date | Buyer | Sale Price | Title Company |
|---|---|---|---|
| Ray Faye M | $62,000 | Chicago Titlte West | |
| Detterman Douglas K | -- | Chicago Title West | |
| Damon K Betterman | $27,000 | -- | |
| -- | -- | -- | |
| -- | -- | -- |
Source: Public Records
Mortgage History
| Date | Status | Borrower | Loan Amount |
|---|---|---|---|
| Open | Ray Faye M | $81,050 | |
| Previous Owner | Damon K Betterman | $60,000 |
Source: Public Records
Tax History Compared to Growth
Tax History
| Year | Tax Paid | Tax Assessment Tax Assessment Total Assessment is a certain percentage of the fair market value that is determined by local assessors to be the total taxable value of land and additions on the property. | Land | Improvement |
|---|---|---|---|---|
| 2024 | $3,719 | $64,400 | $8,820 | $55,580 |
| 2023 | $3,680 | $64,400 | $8,820 | $55,580 |
| 2022 | $2,756 | $37,840 | $5,390 | $32,450 |
| 2021 | $2,760 | $37,840 | $5,390 | $32,450 |
| 2020 | $2,763 | $37,840 | $5,390 | $32,450 |
| 2019 | $2,392 | $30,320 | $4,310 | $26,010 |
| 2018 | $2,126 | $30,320 | $4,310 | $26,010 |
| 2017 | $2,389 | $30,320 | $4,310 | $26,010 |
| 2016 | $2,134 | $24,470 | $3,500 | $20,970 |
| 2015 | $1,862 | $24,470 | $3,500 | $20,970 |
| 2014 | $1,865 | $24,470 | $3,500 | $20,970 |
| 2013 | $1,018 | $27,195 | $3,885 | $23,310 |
Source: Public Records
Map
Nearby Homes
- 2283 Ward Rd
- 2220 Sale Rd
- 2219 Sale Rd
- 4090 Cleveland Ave
- 2194 Ashley Dr
- 2023 Ferris Rd
- 2529 Ferris Park Dr S
- 1997 Ferris Rd
- 2547 Ferris Park Dr S
- 2144 Colfax Ave
- 4111 Walford St
- 4217 Hickman Rd
- 1936 Case Rd
- 3685 Cleveland Ave
- 3609 Westerville Rd Unit P-49
- 2015 Melrose Ave
- 1896 Ormond Ave
- 4309 Walford St
- 2640 Milverton Way
- 1863 Ward Rd