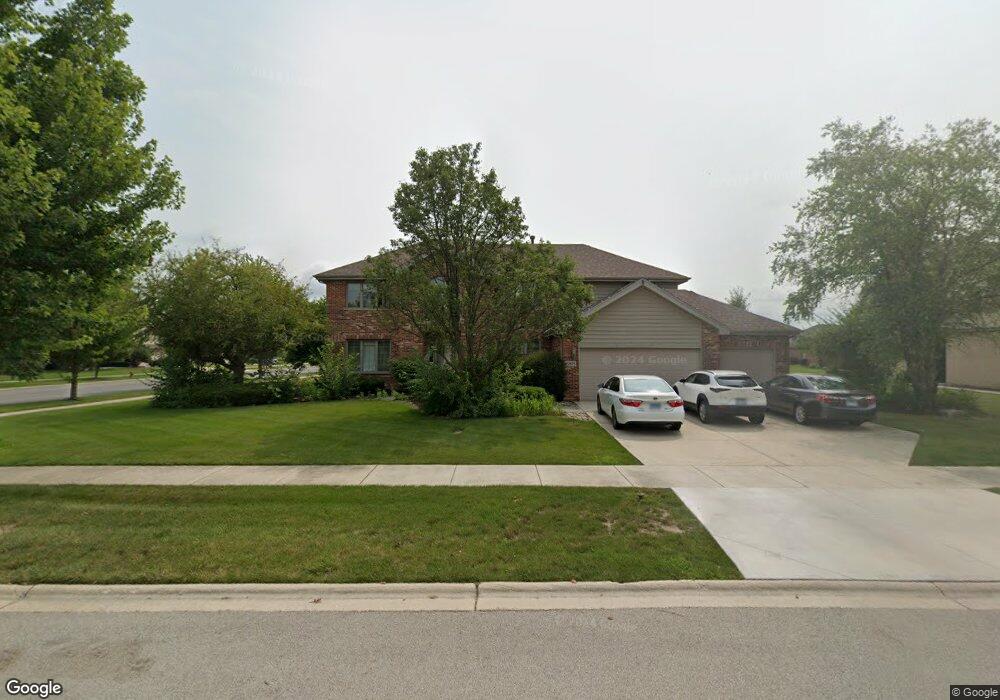
22623 Joshua Dr Unit 2 Frankfort, IL 60423
Lakeview Estates NeighborhoodEstimated Value: $618,000 - $785,000
5
Beds
4
Baths
4,207
Sq Ft
$165/Sq Ft
Est. Value
About This Home
This home is located at 22623 Joshua Dr Unit 2, Frankfort, IL 60423 and is currently estimated at $694,896, approximately $165 per square foot. 22623 Joshua Dr Unit 2 is a home located in Will County with nearby schools including Grand Prairie Elementary School, Chelsea Intermediate School, and Hickory Creek Middle School.
Ownership History
Date
Name
Owned For
Owner Type
Purchase Details
Closed on
Aug 30, 2011
Sold by
Wiles Peter J and Wilkes Amy C
Bought by
Zekarias Fithun E and Tadese Trina
Current Estimated Value
Home Financials for this Owner
Home Financials are based on the most recent Mortgage that was taken out on this home.
Original Mortgage
$300,000
Interest Rate
4.09%
Mortgage Type
New Conventional
Purchase Details
Closed on
Sep 24, 2004
Sold by
Nlsb
Bought by
Wilkes Peter J and Wilkes Amy C
Home Financials for this Owner
Home Financials are based on the most recent Mortgage that was taken out on this home.
Original Mortgage
$292,986
Interest Rate
5.89%
Mortgage Type
Purchase Money Mortgage
Purchase Details
Closed on
Sep 29, 2003
Sold by
Lakeview Estates Development Llc
Bought by
Nlsb Trust #2810
Home Financials for this Owner
Home Financials are based on the most recent Mortgage that was taken out on this home.
Original Mortgage
$1,380,977
Interest Rate
4%
Mortgage Type
Purchase Money Mortgage
Create a Home Valuation Report for This Property
The Home Valuation Report is an in-depth analysis detailing your home's value as well as a comparison with similar homes in the area
Home Values in the Area
Average Home Value in this Area
Purchase History
| Date | Buyer | Sale Price | Title Company |
|---|---|---|---|
| Zekarias Fithun E | $375,000 | Fidelity National Title | |
| Wilkes Peter J | $358,500 | First American Title | |
| Nlsb Trust #2810 | $1,840,000 | First American Title |
Source: Public Records
Mortgage History
| Date | Status | Borrower | Loan Amount |
|---|---|---|---|
| Previous Owner | Zekarias Fithun E | $300,000 | |
| Previous Owner | Wilkes Peter J | $292,986 | |
| Previous Owner | Nlsb Trust #2810 | $1,380,977 | |
| Closed | Wilkes Peter J | $18,135 |
Source: Public Records
Tax History Compared to Growth
Tax History
| Year | Tax Paid | Tax Assessment Tax Assessment Total Assessment is a certain percentage of the fair market value that is determined by local assessors to be the total taxable value of land and additions on the property. | Land | Improvement |
|---|---|---|---|---|
| 2024 | $13,948 | $184,038 | $48,286 | $135,752 |
| 2023 | $13,948 | $164,364 | $43,124 | $121,240 |
| 2022 | $12,196 | $149,708 | $39,279 | $110,429 |
| 2021 | $11,505 | $140,058 | $36,747 | $103,311 |
| 2020 | $11,221 | $136,110 | $35,711 | $100,399 |
| 2019 | $10,863 | $132,467 | $34,755 | $97,712 |
| 2018 | $10,672 | $128,659 | $33,756 | $94,903 |
| 2017 | $10,666 | $125,656 | $32,968 | $92,688 |
| 2016 | $10,419 | $121,348 | $31,838 | $89,510 |
| 2015 | $10,020 | $117,075 | $30,717 | $86,358 |
| 2014 | $10,020 | $116,261 | $30,503 | $85,758 |
| 2013 | $10,020 | $117,768 | $30,898 | $86,870 |
Source: Public Records
Map
Nearby Homes
- 22736 Parkview Ln
- 22430 Woodland Ln
- The Caellin 2000 Plan at Timbers Edge
- The Caellin Plan at Timbers Edge
- The Devin 2000 Plan at Timbers Edge
- The Camden II Plan at Timbers Edge
- The Tegan Plan at Timbers Edge
- The Regan Plan at Timbers Edge
- The Aran Plan at Timbers Edge
- The Brennan Plan at Timbers Edge
- The Devin 1800 Plan at Timbers Edge
- The Country Devin Plan at Timbers Edge
- The Devin III Plan at Timbers Edge
- 22451 S 80th Ave
- 23039 Lakeview Estates Blvd
- 22664 Oakfield Dr
- Vacant Lot W Sauk Trail
- 0000 W Laraway Rd
- The Sommerville Plan at Crystal Brook
- The Prairie II Plan at Crystal Brook
- 22637 Joshua Dr
- 22620 Maddeline Ln
- 22634 Maddeline Ln
- 22547 Joshua Dr
- 22651 Joshua Dr
- 22616 Joshua Dr
- 22630 Joshua Dr
- 8280 Pine Ridge Dr Unit 2
- 22648 Maddeline Ln
- 22542 Joshua Dr
- 22644 Joshua Dr
- 22531 Joshua Dr
- 8240 Pine Ridge Dr
- 22662 Maddeline Ln
- 22629 Parkview Ln
- 22530 Joshua Dr Unit 2
- 22627 Maddeline Ln
- 22658 Joshua Dr
- 22641 Maddeline Ln
- 22643 Parkview Ln