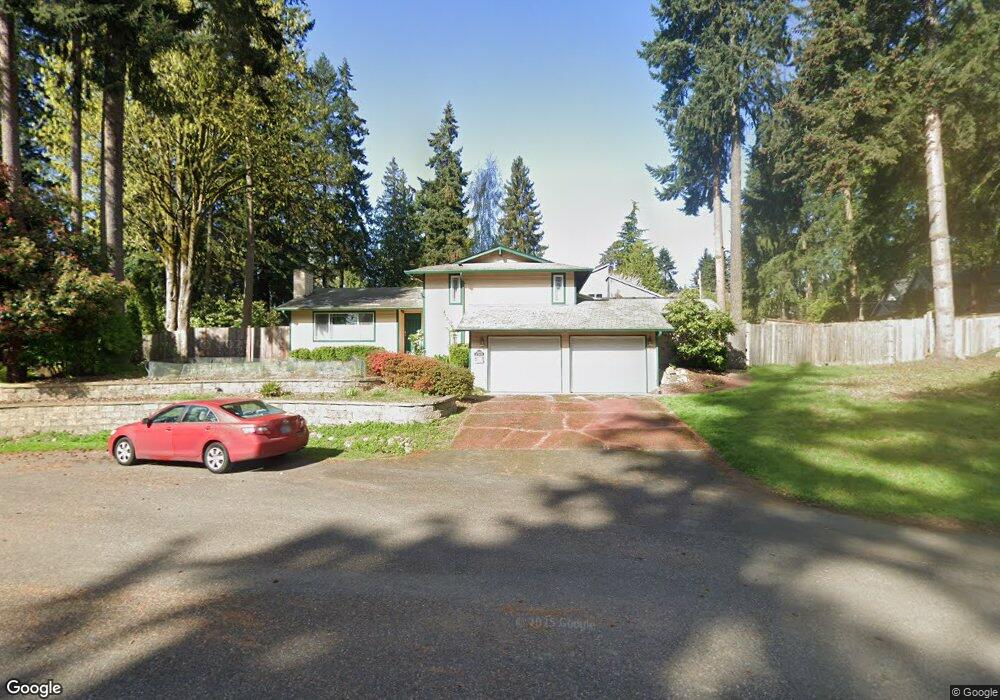
22624 1st Dr SE Bothell, WA 98021
Queensborough-Brentwood NeighborhoodEstimated Value: $830,000 - $995,000
3
Beds
3
Baths
477
Sq Ft
$1,902/Sq Ft
Est. Value
About This Home
This home is located at 22624 1st Dr SE, Bothell, WA 98021 and is currently estimated at $907,318, approximately $1,902 per square foot. 22624 1st Dr SE is a home located in Snohomish County with nearby schools including Frank Love Elementary School, Kenmore Middle School, and Bothell High School.
Ownership History
Date
Name
Owned For
Owner Type
Purchase Details
Closed on
Mar 25, 2015
Sold by
Prince Katherine E
Bought by
Brown Christina M
Current Estimated Value
Home Financials for this Owner
Home Financials are based on the most recent Mortgage that was taken out on this home.
Original Mortgage
$263,680
Outstanding Balance
$198,747
Interest Rate
3.65%
Mortgage Type
New Conventional
Estimated Equity
$708,571
Purchase Details
Closed on
Aug 24, 2006
Sold by
Kemp Darcy L and Kemp Pong Darcy L
Bought by
Brown Christina M and Prince Katherine E
Home Financials for this Owner
Home Financials are based on the most recent Mortgage that was taken out on this home.
Original Mortgage
$300,000
Interest Rate
6.7%
Mortgage Type
Purchase Money Mortgage
Purchase Details
Closed on
Nov 10, 2000
Sold by
Ackert Gail M and Ackert Yvonne M
Bought by
Pong Skookumchuck and Kemp Pong Darcy L
Home Financials for this Owner
Home Financials are based on the most recent Mortgage that was taken out on this home.
Original Mortgage
$177,600
Interest Rate
6.5%
Create a Home Valuation Report for This Property
The Home Valuation Report is an in-depth analysis detailing your home's value as well as a comparison with similar homes in the area
Home Values in the Area
Average Home Value in this Area
Purchase History
| Date | Buyer | Sale Price | Title Company |
|---|---|---|---|
| Brown Christina M | $130,048 | Rainier Title Llc | |
| Brown Christina M | $375,000 | Chicago | |
| Pong Skookumchuck | $222,000 | -- |
Source: Public Records
Mortgage History
| Date | Status | Borrower | Loan Amount |
|---|---|---|---|
| Open | Brown Christina M | $263,680 | |
| Previous Owner | Brown Christina M | $300,000 | |
| Previous Owner | Pong Skookumchuck | $177,600 | |
| Closed | Pong Skookumchuck | $44,400 |
Source: Public Records
Tax History
| Year | Tax Paid | Tax Assessment Tax Assessment Total Assessment is a certain percentage of the fair market value that is determined by local assessors to be the total taxable value of land and additions on the property. | Land | Improvement |
|---|---|---|---|---|
| 2026 | $6,779 | $838,700 | $580,000 | $258,700 |
| 2025 | $6,109 | $800,700 | $545,000 | $255,700 |
| 2024 | $6,109 | $717,800 | $470,000 | $247,800 |
| 2023 | $6,851 | $883,200 | $600,000 | $283,200 |
| 2022 | $6,074 | $631,100 | $390,000 | $241,100 |
| 2020 | $5,426 | $522,200 | $311,000 | $211,200 |
| 2019 | $4,729 | $470,500 | $265,000 | $205,500 |
| 2018 | $4,443 | $425,800 | $240,000 | $185,800 |
| 2017 | $3,665 | $353,600 | $180,000 | $173,600 |
| 2016 | $3,242 | $322,100 | $155,000 | $167,100 |
| 2015 | $3,159 | $297,600 | $143,000 | $154,600 |
| 2013 | $2,970 | $246,400 | $113,000 | $133,400 |
Source: Public Records
Map
Nearby Homes
- 100 228th St SE Unit 19B
- 22827 Meridian Ave S
- 22720 2nd Place W
- 22717 4th Ave SE
- 22619 4th Ave W Unit 3-103
- 224 224th St SW
- 22426 3rd Place W
- 29 232nd Place SW
- 404 228th St SW Unit E101
- 18 232nd Place SW
- 19924 7th Dr SE
- 20021 7th Dr SE
- 20027 7th Dr SE
- 104 219th Place SE
- 23022 7th Ave SE
- 22621 8th Dr SE
- 600 228th St SW Unit I101
- 237 234th Place SE
- 917 228th St SE
- 714 228th St SW Unit O101
- 22612 1st Dr SE
- 22619 Meridian Ave S
- 22706 1st Dr SE
- 22705 1st Dr SE
- 22623 Meridian Ave S
- 22710 1st Dr SE
- 22613 Meridian Ave S
- 22703 Meridian Ave S
- 22602 1st Dr SE
- 22605 1st Dr SE
- 31 228th St SE
- 22627 Meridian Ave S
- 22529 1st Dr SE
- 22521 Meridian Ave S
- 21 228th St SE
- 22605 Meridian Ave S
- 22520 1st Dr SE
- 22527 Meridian Ave S
- 22729 Meridian Ave S
- 22521 1st Dr SE
Your Personal Tour Guide
Ask me questions while you tour the home.