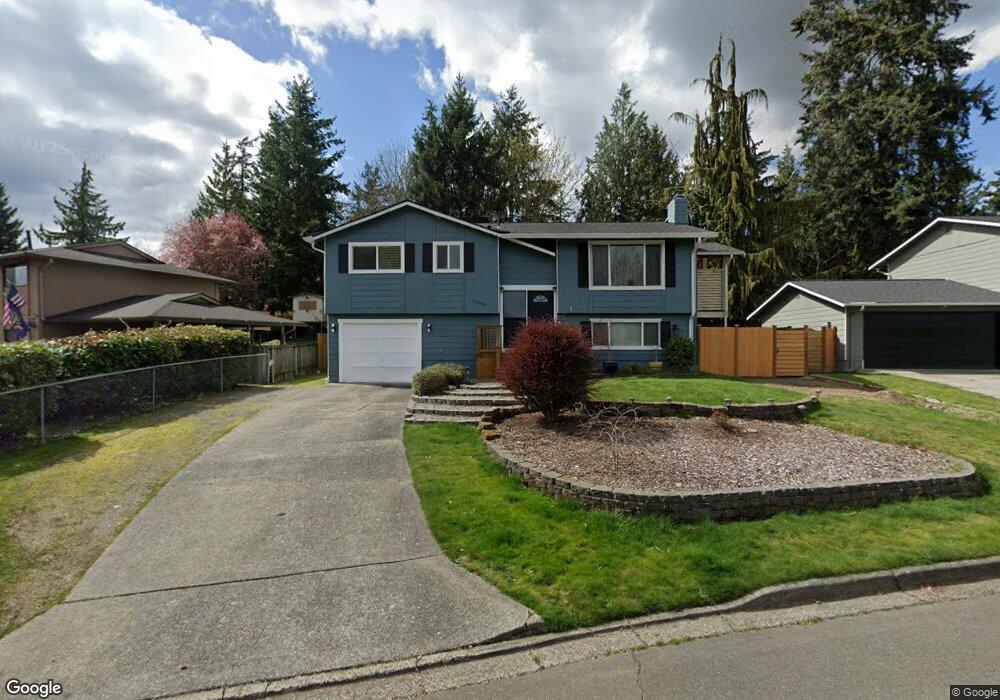
22630 2nd Place W Bothell, WA 98021
Queensborough-Brentwood NeighborhoodEstimated Value: $799,624 - $945,000
3
Beds
2
Baths
1,836
Sq Ft
$476/Sq Ft
Est. Value
About This Home
This home is located at 22630 2nd Place W, Bothell, WA 98021 and is currently estimated at $873,156, approximately $475 per square foot. 22630 2nd Place W is a home located in Snohomish County with nearby schools including Frank Love Elementary School, Kenmore Middle School, and Bothell High School.
Ownership History
Date
Name
Owned For
Owner Type
Purchase Details
Closed on
Jun 4, 2007
Sold by
Walter Mark M and Walter Jennifer L
Bought by
Tamura Genta and Tsuzuki Rie
Current Estimated Value
Home Financials for this Owner
Home Financials are based on the most recent Mortgage that was taken out on this home.
Original Mortgage
$329,600
Outstanding Balance
$195,198
Interest Rate
6.14%
Mortgage Type
Purchase Money Mortgage
Estimated Equity
$677,958
Purchase Details
Closed on
Feb 24, 2005
Sold by
Hegrenes Dave H and Hegrenes Linda A
Bought by
Walter Mark M and Walter Jennifer L
Home Financials for this Owner
Home Financials are based on the most recent Mortgage that was taken out on this home.
Original Mortgage
$218,400
Interest Rate
5.12%
Mortgage Type
Purchase Money Mortgage
Purchase Details
Closed on
Jun 8, 1998
Sold by
Young Lee Joong Ku and Young Lee So
Bought by
Hegrenes David H and Hegrenes Linda A
Home Financials for this Owner
Home Financials are based on the most recent Mortgage that was taken out on this home.
Original Mortgage
$144,000
Interest Rate
7.17%
Create a Home Valuation Report for This Property
The Home Valuation Report is an in-depth analysis detailing your home's value as well as a comparison with similar homes in the area
Home Values in the Area
Average Home Value in this Area
Purchase History
| Date | Buyer | Sale Price | Title Company |
|---|---|---|---|
| Tamura Genta | $412,000 | Rainier Title | |
| Walter Mark M | $273,000 | First American Title Ins Co | |
| Hegrenes David H | $180,000 | First American Title Co |
Source: Public Records
Mortgage History
| Date | Status | Borrower | Loan Amount |
|---|---|---|---|
| Open | Tamura Genta | $329,600 | |
| Previous Owner | Walter Mark M | $218,400 | |
| Previous Owner | Hegrenes David H | $144,000 | |
| Closed | Walter Mark M | $27,250 |
Source: Public Records
Tax History
| Year | Tax Paid | Tax Assessment Tax Assessment Total Assessment is a certain percentage of the fair market value that is determined by local assessors to be the total taxable value of land and additions on the property. | Land | Improvement |
|---|---|---|---|---|
| 2026 | $6,016 | $793,300 | $546,800 | $246,500 |
| 2025 | $5,551 | $707,000 | $470,300 | $236,700 |
| 2024 | $5,551 | $649,400 | $422,800 | $226,600 |
| 2023 | $6,458 | $830,700 | $570,000 | $260,700 |
| 2022 | $6,136 | $637,800 | $417,100 | $220,700 |
| 2020 | $5,302 | $509,800 | $317,000 | $192,800 |
| 2019 | $4,536 | $450,400 | $265,000 | $185,400 |
| 2018 | $4,194 | $400,900 | $235,000 | $165,900 |
| 2017 | $3,514 | $338,200 | $185,000 | $153,200 |
| 2016 | $3,164 | $314,000 | $165,000 | $149,000 |
| 2015 | $3,080 | $289,800 | $155,000 | $134,800 |
| 2013 | $2,806 | $232,100 | $127,000 | $105,100 |
Source: Public Records
Map
Nearby Homes
- 22619 4th Ave W Unit 3-103
- 22426 3rd Place W
- 404 228th St SW Unit E101
- 224 224th St SW
- 22827 Meridian Ave S
- 600 228th St SW Unit I101
- 100 228th St SE Unit 19B
- 714 228th St SW Unit O101
- 29 232nd Place SW
- 18 232nd Place SW
- 104 219th Place SE
- 601 220th St SW
- 23619 5th Ave W
- 21713 Meridian Ave S
- 23629 3rd Place W
- 23022 7th Ave SE
- 19924 7th Dr SE
- 20021 7th Dr SE
- 20027 7th Dr SE
- 624 217th St SW
- 22702 2nd Place W
- 22624 2nd Place W
- 22715 4th Ave W
- 22715 4th Ave W Unit 106
- 22715 4th Ave W Unit 105
- 22715 4th Ave W Unit 104
- 22715 4th Ave W Unit 103
- 22715 4th Ave W Unit 101
- 22616 2nd Place W
- 22710 2nd Place W
- 22627 2nd Place W
- 22619 4th Ave W Unit 106
- 22619 4th Ave W Unit 105
- 22619 4th Ave W Unit 104
- 22619 4th Ave W Unit 103
- 22619 4th Ave W Unit 101
- 22703 2nd Place W
- 22608 2nd Place W
- 22727 4th Ave W
- 22727 4th Ave W
Your Personal Tour Guide
Ask me questions while you tour the home.