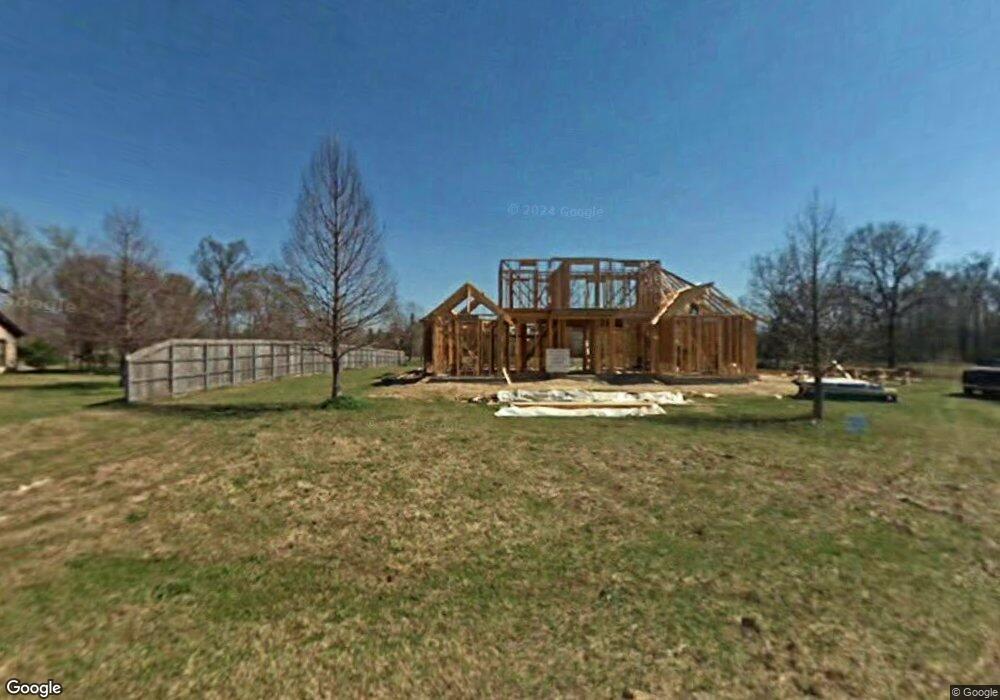
22630 S Hickey Ct Zachary, LA 70791
Estimated Value: $475,000 - $589,000
--
Bed
--
Bath
3,147
Sq Ft
$164/Sq Ft
Est. Value
About This Home
This home is located at 22630 S Hickey Ct, Zachary, LA 70791 and is currently estimated at $514,650, approximately $163 per square foot. 22630 S Hickey Ct is a home located in East Baton Rouge Parish with nearby schools including Northwestern Elementary School, Rollins Place Elementary School, and Zachary Elementary School.
Ownership History
Date
Name
Owned For
Owner Type
Purchase Details
Closed on
Oct 12, 2012
Sold by
American Gateway Bank
Bought by
Wilson Jason B
Current Estimated Value
Home Financials for this Owner
Home Financials are based on the most recent Mortgage that was taken out on this home.
Original Mortgage
$260,000
Outstanding Balance
$180,888
Interest Rate
3.61%
Mortgage Type
New Conventional
Estimated Equity
$333,762
Purchase Details
Closed on
Jun 13, 2012
Sold by
Gautreaux Sheriff Sid J and Wilson Jason B
Bought by
American Gareway Bank
Purchase Details
Closed on
Feb 1, 2007
Sold by
Avaa Investment Group
Bought by
Wilson Jason B
Home Financials for this Owner
Home Financials are based on the most recent Mortgage that was taken out on this home.
Original Mortgage
$74,000
Interest Rate
6.19%
Mortgage Type
New Conventional
Purchase Details
Closed on
Jan 19, 2006
Sold by
Chaney John L
Bought by
Avaa Investment Group
Create a Home Valuation Report for This Property
The Home Valuation Report is an in-depth analysis detailing your home's value as well as a comparison with similar homes in the area
Home Values in the Area
Average Home Value in this Area
Purchase History
| Date | Buyer | Sale Price | Title Company |
|---|---|---|---|
| Wilson Jason B | $285,000 | -- | |
| American Gareway Bank | $225,000 | -- | |
| Wilson Jason B | $87,000 | -- | |
| Avaa Investment Group | $77,000 | -- |
Source: Public Records
Mortgage History
| Date | Status | Borrower | Loan Amount |
|---|---|---|---|
| Open | Wilson Jason B | $260,000 | |
| Previous Owner | Wilson Jason B | $74,000 |
Source: Public Records
Tax History Compared to Growth
Tax History
| Year | Tax Paid | Tax Assessment Tax Assessment Total Assessment is a certain percentage of the fair market value that is determined by local assessors to be the total taxable value of land and additions on the property. | Land | Improvement |
|---|---|---|---|---|
| 2024 | $4,472 | $35,150 | $8,700 | $26,450 |
| 2023 | $4,596 | $30,650 | $8,700 | $21,950 |
| 2022 | $3,984 | $30,650 | $8,700 | $21,950 |
| 2021 | $3,984 | $30,650 | $8,700 | $21,950 |
| 2020 | $3,961 | $30,650 | $8,700 | $21,950 |
| 2019 | $3,703 | $26,150 | $8,700 | $17,450 |
| 2018 | $3,716 | $26,150 | $8,700 | $17,450 |
| 2017 | $3,716 | $26,150 | $8,700 | $17,450 |
| 2016 | $2,604 | $26,150 | $8,700 | $17,450 |
| 2015 | $2,532 | $25,650 | $8,700 | $16,950 |
| 2014 | $2,525 | $25,650 | $8,700 | $16,950 |
| 2013 | -- | $25,650 | $8,700 | $16,950 |
Source: Public Records
Map
Nearby Homes
- 22614 Plainsland Dr
- 347 E Plains Port Hudson Rd
- 22977 Treakle Ln
- 23045 Elberta Ln
- 22881 Brittney Renee Dr
- 21321 Samuels Rd
- 22336 Sutter Ln
- 134 E Plains-Port Hudson Rd
- 23316 Elberta Ln
- 22460 Sutter Ln
- TL-1 W Flonacher Rd
- 0 W Flonacher Rd
- 23413 Treakle Ln
- 22658 Sutter Ln
- 25247 Shane Ct
- 23123 Sunnyside Ln
- 23324 Portwood Ln
- 22747 Beaver Cove Ct
- 23434 Portwood Ln
- 25423 Renee Ct
- 22640 S Hickey Ct
- 22621 S Hickey Ct
- 22620 S Hickey Ct
- 22650 S Hickey Ct
- 22641 S Hickey Ct
- 47 S Hickey Ct
- 0 S Hickey Ct
- 22731 Hickey Ct
- 22611 S Hickey Ct
- 22730 S Hickey Ct
- 22610 S Hickey Ct
- 231 Treakle Ln
- 240 Treakle Ln
- 22822 Hickey Ct
- 22721 Hickey Ct
- 22720 Hickey Ct
- 22832 Hickey Ct
- 22725 Plainsland Dr
- 231 E Flonacher Rd
- 22633 Plainsland Dr