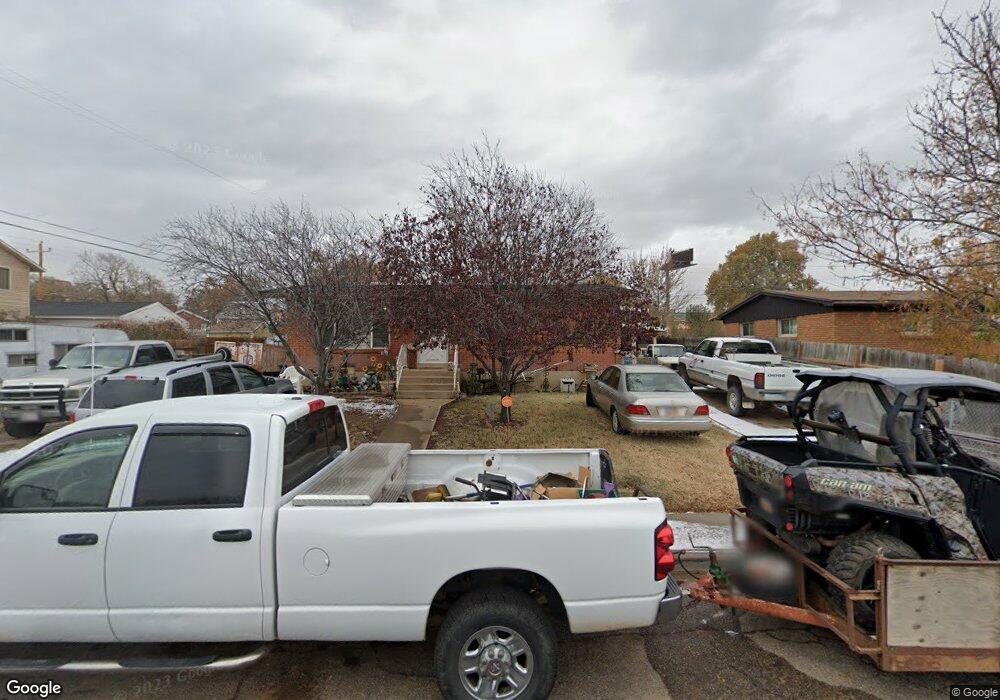
2264 N 125 W Clearfield, UT 84015
Estimated Value: $343,000 - $377,000
3
Beds
2
Baths
1,008
Sq Ft
$363/Sq Ft
Est. Value
About This Home
This home is located at 2264 N 125 W, Clearfield, UT 84015 and is currently estimated at $366,233, approximately $363 per square foot. 2264 N 125 W is a home located in Davis County with nearby schools including Sunset School, Sunset Junior High School, and Northridge High School.
Ownership History
Date
Name
Owned For
Owner Type
Purchase Details
Closed on
Aug 22, 2025
Sold by
Hinkley Living Trust and Hinkley Darrel Kenneth
Bought by
Hinkley Living Trust and Hinkley
Current Estimated Value
Purchase Details
Closed on
Apr 24, 2025
Sold by
Hinkley Darrell Kenneth and Hinkley Ellen Flint
Bought by
Hinkley Living Trust and Hinkley
Home Financials for this Owner
Home Financials are based on the most recent Mortgage that was taken out on this home.
Original Mortgage
$101,548
Interest Rate
5.8%
Mortgage Type
New Conventional
Purchase Details
Closed on
Mar 4, 2022
Sold by
Flint Hinkley Ellen
Bought by
Hinkley Darrel Kenneth
Home Financials for this Owner
Home Financials are based on the most recent Mortgage that was taken out on this home.
Original Mortgage
$240,000
Interest Rate
3.92%
Mortgage Type
New Conventional
Purchase Details
Closed on
Feb 10, 2021
Sold by
Hinkley Darrel K and Hinkley Ellen F
Bought by
Hinkley Darrel Kenneth and Hinkley Ellen Flint
Create a Home Valuation Report for This Property
The Home Valuation Report is an in-depth analysis detailing your home's value as well as a comparison with similar homes in the area
Home Values in the Area
Average Home Value in this Area
Purchase History
| Date | Buyer | Sale Price | Title Company |
|---|---|---|---|
| Hinkley Living Trust | -- | Stewart Title | |
| Hinkley Living Trust | -- | Stewart Title | |
| Hinkley Living Trust | -- | Stewart Title | |
| Hinkley Darrel Kenneth | -- | Stewart Title | |
| Hinkley Darrel Kenneth | -- | Stewart Title | |
| Hinkley Darrel Kenneth | -- | None Listed On Document | |
| Hinkley Ellen Flint | -- | None Listed On Document | |
| Hinkley Darrel Kenneth | -- | None Available |
Source: Public Records
Mortgage History
| Date | Status | Borrower | Loan Amount |
|---|---|---|---|
| Previous Owner | Hinkley Darrel Kenneth | $101,548 | |
| Previous Owner | Hinkley Ellen Flint | $240,000 |
Source: Public Records
Tax History Compared to Growth
Tax History
| Year | Tax Paid | Tax Assessment Tax Assessment Total Assessment is a certain percentage of the fair market value that is determined by local assessors to be the total taxable value of land and additions on the property. | Land | Improvement |
|---|---|---|---|---|
| 2025 | $2,267 | $206,800 | $73,665 | $133,135 |
| 2024 | $2,056 | $187,550 | $70,417 | $117,133 |
| 2023 | $1,924 | $320,000 | $112,552 | $207,448 |
| 2022 | $2,053 | $184,801 | $64,433 | $120,368 |
| 2021 | $1,767 | $250,000 | $69,058 | $180,942 |
| 2020 | $1,552 | $216,000 | $58,200 | $157,800 |
| 2019 | $1,429 | $204,000 | $74,527 | $129,473 |
| 2018 | $1,267 | $177,000 | $59,558 | $117,442 |
| 2016 | $1,076 | $77,220 | $28,159 | $49,061 |
| 2015 | $1,102 | $74,965 | $28,159 | $46,806 |
| 2014 | $1,003 | $69,746 | $28,159 | $41,587 |
| 2013 | -- | $66,117 | $23,265 | $42,852 |
Source: Public Records
Map
Nearby Homes
- 2101 N Main St Unit 205
- 2101 N Main St Unit 409
- 2085 N Main St Unit 409
- 2085 N Main St Unit 108
- 2085 N Main St Unit 401
- 2085 N Main St Unit 308
- 2085 N Main St Unit 116
- 2085 N Main St Unit 201
- 2085 N Main St Unit 402
- 2085 N Main St Unit 202
- 2085 N Main St Unit 301
- 2085 N Main St Unit 302
- 2085 N Main St Unit 115
- 52 W 2000 N
- 1974 N 75 W
- 244 W 2575 N
- 2622 N 175 W
- 2616 2125 W
- 2622 2125 W
- 2632 2125 W