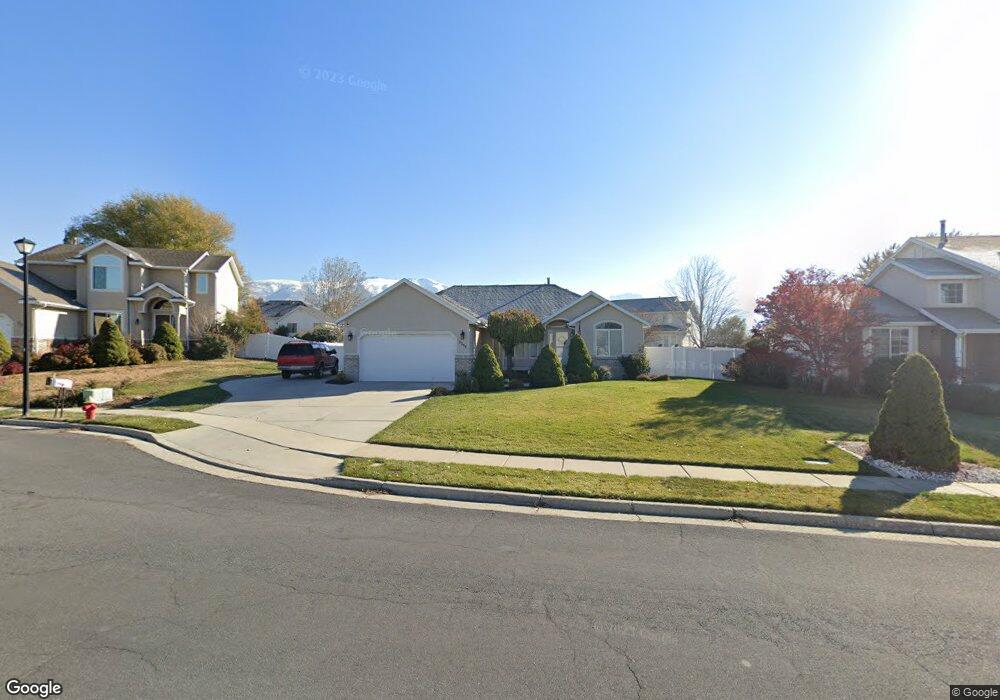
2264 N 900 W Layton, UT 84041
Estimated Value: $578,000 - $625,000
6
Beds
3
Baths
3,413
Sq Ft
$176/Sq Ft
Est. Value
About This Home
This home is located at 2264 N 900 W, Layton, UT 84041 and is currently estimated at $600,291, approximately $175 per square foot. 2264 N 900 W is a home located in Davis County with nearby schools including Lincoln Elementary School, North Layton Junior High School, and Northridge High School.
Ownership History
Date
Name
Owned For
Owner Type
Purchase Details
Closed on
Jan 23, 2015
Sold by
Robins Thomas Richard and Robins Mary Lou
Bought by
From That To This Llc
Current Estimated Value
Purchase Details
Closed on
Sep 16, 1998
Sold by
Symmetry Development Inc
Bought by
Almond Cameron K and Almond Pamela J
Home Financials for this Owner
Home Financials are based on the most recent Mortgage that was taken out on this home.
Original Mortgage
$180,250
Interest Rate
7.37%
Mortgage Type
VA
Purchase Details
Closed on
Mar 27, 1998
Sold by
Sli Commercial Real Estate Co
Bought by
Symmetry Development Inc
Create a Home Valuation Report for This Property
The Home Valuation Report is an in-depth analysis detailing your home's value as well as a comparison with similar homes in the area
Home Values in the Area
Average Home Value in this Area
Purchase History
| Date | Buyer | Sale Price | Title Company |
|---|---|---|---|
| From That To This Llc | -- | Cottonwood Title I | |
| Robins Thomas Richard | -- | Cottonwood Title | |
| Almond Cameron K | -- | Bonneville Title Company Inc | |
| Symmetry Development Inc | -- | Bonneville Title Company Inc |
Source: Public Records
Mortgage History
| Date | Status | Borrower | Loan Amount |
|---|---|---|---|
| Previous Owner | Almond Cameron K | $180,250 |
Source: Public Records
Tax History
| Year | Tax Paid | Tax Assessment Tax Assessment Total Assessment is a certain percentage of the fair market value that is determined by local assessors to be the total taxable value of land and additions on the property. | Land | Improvement |
|---|---|---|---|---|
| 2025 | -- | $297,000 | $114,829 | $182,171 |
| 2024 | -- | $286,550 | $132,985 | $153,565 |
| 2023 | $922 | $521,000 | $150,754 | $370,246 |
| 2022 | $922 | $292,050 | $81,875 | $210,175 |
| 2021 | $1,009 | $403,000 | $120,811 | $282,189 |
| 2020 | $725 | $352,000 | $99,113 | $252,887 |
| 2019 | $632 | $332,000 | $91,877 | $240,123 |
| 2018 | $634 | $327,000 | $91,877 | $235,123 |
| 2016 | $358 | $152,900 | $30,982 | $121,918 |
| 2015 | $1,820 | $126,885 | $30,982 | $95,903 |
| 2014 | $1,887 | $134,577 | $30,982 | $103,595 |
| 2013 | -- | $121,094 | $27,112 | $93,982 |
Source: Public Records
Map
Nearby Homes
- 820 W 2350 N
- 2386 N 800 W
- 2320 N 1085 W
- 1012 W 2525 N
- 2236 N 525 W
- 506 W 2200 N
- 498 W 2200 N
- 2246 N 475 W
- 2234 N 450 W
- 2214 N 450 W
- 621 Paul Ave
- 1094 N Angel St W
- 1619 N Angel St W
- 1621 N Angel St W
- 1617 N Angel St
- 1498 W 1850 N
- 1615 N Angel St W
- 2893 N 1150 W
- 2875 N Hill Field Rd Unit 17
- 2875 N Hill Field Rd Unit 199
Your Personal Tour Guide
Ask me questions while you tour the home.