Estimated Value: $442,000 - $473,196
6
Beds
3
Baths
2,491
Sq Ft
$185/Sq Ft
Est. Value
About This Home
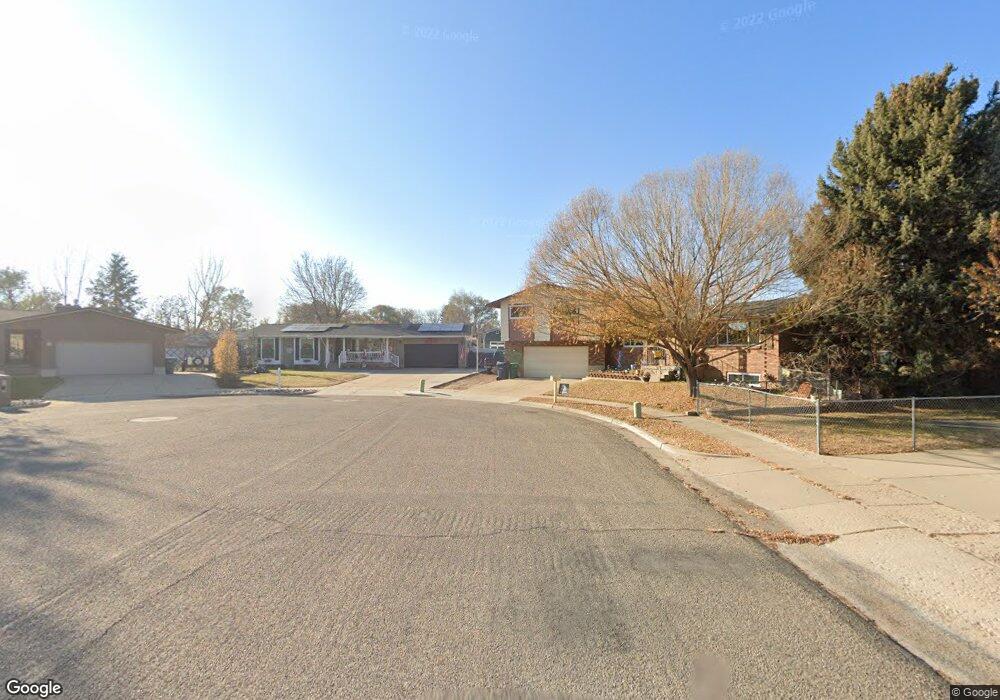
This home is located at 2264 W 4525 S, Roy, UT 84067 and is currently estimated at $460,299, approximately $184 per square foot. 2264 W 4525 S is a home located in Weber County with nearby schools including Valley View School, Sand Ridge Junior High School, and Roy High School.
Ownership History
Date
Name
Owned For
Owner Type
Purchase Details
Closed on
Jul 15, 2009
Sold by
Bellus Paul and Bellus Angela
Bought by
Bellus Paul Clark and Bellus Angela P
Current Estimated Value
Home Financials for this Owner
Home Financials are based on the most recent Mortgage that was taken out on this home.
Original Mortgage
$196,224
Outstanding Balance
$126,625
Interest Rate
5.25%
Mortgage Type
FHA
Estimated Equity
$333,674
Purchase Details
Closed on
Jul 29, 2005
Sold by
Bingham Jeffrey S and Bingham Loralee G
Bought by
Bellus Paul and Bellus Angela
Home Financials for this Owner
Home Financials are based on the most recent Mortgage that was taken out on this home.
Original Mortgage
$131,920
Interest Rate
5.56%
Mortgage Type
Fannie Mae Freddie Mac
Create a Home Valuation Report for This Property
The Home Valuation Report is an in-depth analysis detailing your home's value as well as a comparison with similar homes in the area
Home Values in the Area
Average Home Value in this Area
Purchase History
| Date | Buyer | Sale Price | Title Company |
|---|---|---|---|
| Bellus Paul Clark | -- | Gt Title Services Salt Lake | |
| Bellus Paul | -- | Backman |
Source: Public Records
Mortgage History
| Date | Status | Borrower | Loan Amount |
|---|---|---|---|
| Open | Bellus Paul Clark | $196,224 | |
| Closed | Bellus Paul | $131,920 |
Source: Public Records
Tax History Compared to Growth
Tax History
| Year | Tax Paid | Tax Assessment Tax Assessment Total Assessment is a certain percentage of the fair market value that is determined by local assessors to be the total taxable value of land and additions on the property. | Land | Improvement |
|---|---|---|---|---|
| 2025 | $279 | $460,346 | $159,176 | $301,170 |
| 2024 | $272 | $249,149 | $87,546 | $161,603 |
| 2023 | $2,724 | $240,900 | $86,162 | $154,738 |
| 2022 | $2,670 | $242,000 | $60,611 | $181,389 |
| 2021 | $221 | $339,000 | $73,729 | $265,271 |
| 2020 | $203 | $273,000 | $73,729 | $199,271 |
| 2019 | $201 | $244,000 | $43,670 | $200,330 |
| 2018 | $199 | $215,000 | $40,611 | $174,389 |
| 2017 | $198 | $202,000 | $40,611 | $161,389 |
| 2016 | $194 | $96,759 | $18,743 | $78,016 |
| 2015 | $191 | $85,126 | $18,743 | $66,383 |
| 2014 | $188 | $78,375 | $18,743 | $59,632 |
Source: Public Records
Map
Nearby Homes
- 2259 W 4525 S
- 2263 W 4400 S
- 2082 W 4450 S
- 2038 W 4600 S
- 4475 S 1975 W
- 4328 S 2175 W
- 2067 W 4750 S
- 2153 W 4800 S
- 1952 W 5450 S
- 4670 S 2525 W
- 4848 S 2125 W
- 4642 S 1900 W Unit 41
- 2642 W 4400 S
- 4536 S 1900 W Unit 12
- 2411 W 4900 S
- 2015 W 4225 S
- 4220 S 2075 W
- 4205 S 2075 W
- 1825 W 4500 S Unit 101
- 4164 S 2400 W