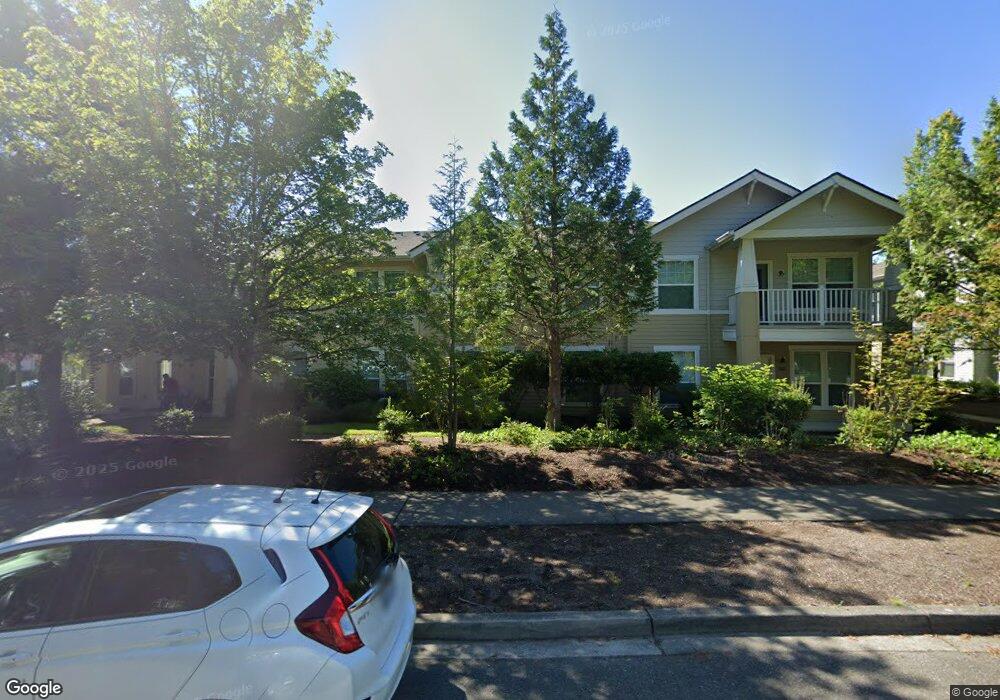
22657 NE Alder Crest Dr Unit 204 Redmond, WA 98053
Union Hill-Novelty Hill NeighborhoodEstimated Value: $782,000 - $828,000
3
Beds
2
Baths
1,350
Sq Ft
$589/Sq Ft
Est. Value
About This Home
This home is located at 22657 NE Alder Crest Dr Unit 204, Redmond, WA 98053 and is currently estimated at $795,766, approximately $589 per square foot. 22657 NE Alder Crest Dr Unit 204 is a home located in King County with nearby schools including Rosa Parks Elementary School, Timberline Middle School, and Redmond High School.
Ownership History
Date
Name
Owned For
Owner Type
Purchase Details
Closed on
Jul 2, 2014
Sold by
Reiss Tiffany M and Gentry Catherine E
Bought by
Chieng Sandy
Current Estimated Value
Home Financials for this Owner
Home Financials are based on the most recent Mortgage that was taken out on this home.
Original Mortgage
$151,000
Outstanding Balance
$114,628
Interest Rate
4.07%
Mortgage Type
New Conventional
Estimated Equity
$681,138
Purchase Details
Closed on
Dec 10, 2003
Sold by
Carino Homes Inc
Bought by
Reiss Tiffany M and Gentry Catherine E
Home Financials for this Owner
Home Financials are based on the most recent Mortgage that was taken out on this home.
Original Mortgage
$183,950
Interest Rate
5.97%
Mortgage Type
Purchase Money Mortgage
Create a Home Valuation Report for This Property
The Home Valuation Report is an in-depth analysis detailing your home's value as well as a comparison with similar homes in the area
Home Values in the Area
Average Home Value in this Area
Purchase History
| Date | Buyer | Sale Price | Title Company |
|---|---|---|---|
| Chieng Sandy | $331,000 | Cw Title Co | |
| Reiss Tiffany M | $229,950 | First American |
Source: Public Records
Mortgage History
| Date | Status | Borrower | Loan Amount |
|---|---|---|---|
| Open | Chieng Sandy | $151,000 | |
| Previous Owner | Reiss Tiffany M | $183,950 | |
| Closed | Reiss Tiffany M | $34,450 |
Source: Public Records
Tax History Compared to Growth
Tax History
| Year | Tax Paid | Tax Assessment Tax Assessment Total Assessment is a certain percentage of the fair market value that is determined by local assessors to be the total taxable value of land and additions on the property. | Land | Improvement |
|---|---|---|---|---|
| 2024 | $6,748 | $717,000 | $60,900 | $656,100 |
| 2023 | $5,553 | $769,000 | $60,900 | $708,100 |
| 2022 | $5,021 | $644,000 | $54,100 | $589,900 |
| 2021 | $5,281 | $496,000 | $54,100 | $441,900 |
| 2020 | $5,563 | $476,000 | $47,400 | $428,600 |
| 2018 | $4,757 | $493,000 | $44,000 | $449,000 |
| 2017 | $4,007 | $400,000 | $44,000 | $356,000 |
| 2016 | $3,633 | $337,000 | $47,400 | $289,600 |
| 2015 | $3,959 | $305,000 | $47,400 | $257,600 |
| 2014 | -- | $318,000 | $47,400 | $270,600 |
| 2013 | -- | $244,000 | $47,400 | $196,600 |
Source: Public Records
Map
Nearby Homes
- 10120 225th Terrace NE
- 10129 224th Ave NE
- 10630 221st Ln NE Unit 204
- 10500 221st Ln NE Unit 202
- 9907 223rd Place NE
- 10790 221st Ln NE
- 21710 NE 97th Place
- 9141 229th Place NE
- 11037 236th Place NE
- 8818 230th Way NE
- 23884 NE 112th Cir Unit 2
- 23905 NE 113th Ln Unit 4
- 23910 NE 112th Place Unit 1
- 10909 243rd Ave NE
- 11008 243rd Ave NE
- 23916 NE 115th Ln Unit 204
- 24129 NE 112th Ln Unit 151
- 23925 NE 115th Ln Unit 304
- 24120 NE 112th Ln Unit 113
- 10449 Sheridan Crescent NE
- 22657 NE Alder Crest Dr Unit 101
- 22657 NE Alder Crest Dr Unit 102
- 22657 NE Alder Crest Dr Unit 202
- 22651 NE Alder Crest Dr Unit 102
- 22651 NE Alder Crest Dr Unit 101
- 22663 NE Alder Crest Dr Unit 201
- 22663 NE Alder Crest Dr Unit 202
- 22663 NE Alder Crest Dr Unit 202
- 22663 NE Alder Crest Dr Unit 204
- 22663 NE Alder Crest Dr Unit 102
- 22663 NE Alder Crest Dr Unit 102
- 22663 NE Alder Crest Dr Unit 203
- 22663 NE Alder Crest Dr Unit 201
- 22663 NE Alder Crest Dr Unit 101
- 22675 NE Alder Crest Dr Unit 201
- 22675 NE Alder Crest Dr Unit 102
- 22675 NE Alder Crest Dr Unit 204
- 22675 NE Alder Crest Dr Unit 202
- 22675 NE Alder Crest Dr Unit 202