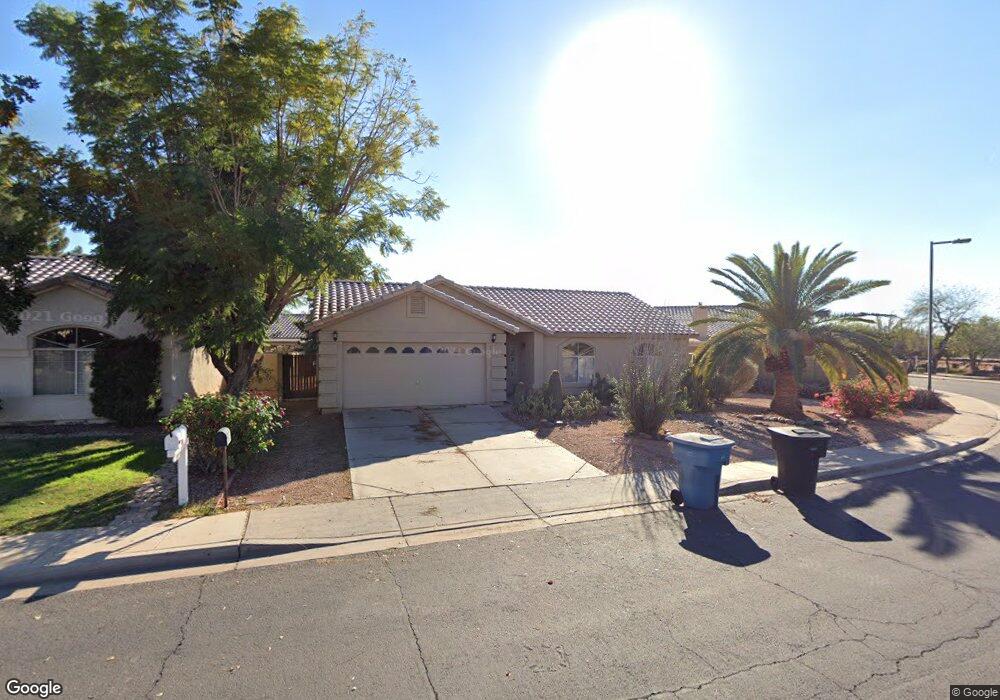
2267 E Ranch Rd Gilbert, AZ 85296
East Gilbert NeighborhoodEstimated Value: $392,261 - $454,000
3
Beds
2
Baths
1,215
Sq Ft
$350/Sq Ft
Est. Value
About This Home
This home is located at 2267 E Ranch Rd, Gilbert, AZ 85296 and is currently estimated at $425,065, approximately $349 per square foot. 2267 E Ranch Rd is a home located in Maricopa County with nearby schools including Finley Farms Elementary School, Greenfield Junior High School, and American Leadership Academy Gilbert North 7-12.
Ownership History
Date
Name
Owned For
Owner Type
Purchase Details
Closed on
Jun 1, 2021
Sold by
Thompson Gena Elizabeth and The Gena Thompson Trust
Bought by
Olympus Borrower Llc
Current Estimated Value
Purchase Details
Closed on
Oct 27, 2012
Sold by
Thompson Gena
Bought by
Thompson Gena Elizabeth and The Gena Thompson Trust
Purchase Details
Closed on
Apr 26, 2011
Sold by
Thompson Gene E
Bought by
Thompson Gene E
Purchase Details
Closed on
Jan 17, 2001
Sold by
Thompson Gene E and Thompson Dorothy V
Bought by
Thompson Gene Edward and Thompson Dorothy Vera
Purchase Details
Closed on
Aug 11, 1995
Sold by
Providence Homes Inc
Bought by
Thompson Gene E and Thompson Dorothy
Home Financials for this Owner
Home Financials are based on the most recent Mortgage that was taken out on this home.
Original Mortgage
$46,700
Interest Rate
5.75%
Mortgage Type
New Conventional
Purchase Details
Closed on
Feb 8, 1995
Sold by
Providence Development Inc
Bought by
Providence Homes Inc
Create a Home Valuation Report for This Property
The Home Valuation Report is an in-depth analysis detailing your home's value as well as a comparison with similar homes in the area
Home Values in the Area
Average Home Value in this Area
Purchase History
| Date | Buyer | Sale Price | Title Company |
|---|---|---|---|
| Olympus Borrower Llc | $360,000 | Magnus Title Agency | |
| Thompson Gena Elizabeth | -- | None Available | |
| Thompson Gene E | -- | None Available | |
| Thompson Gene Edward | -- | -- | |
| Thompson Gene Edward | -- | -- | |
| Thompson Gene E | $87,798 | Security Title Agency | |
| Providence Homes Inc | $75,255 | Security Title Agency |
Source: Public Records
Mortgage History
| Date | Status | Borrower | Loan Amount |
|---|---|---|---|
| Previous Owner | Thompson Gene E | $46,700 |
Source: Public Records
Tax History
| Year | Tax Paid | Tax Assessment Tax Assessment Total Assessment is a certain percentage of the fair market value that is determined by local assessors to be the total taxable value of land and additions on the property. | Land | Improvement |
|---|---|---|---|---|
| 2025 | $1,519 | $16,180 | -- | -- |
| 2024 | $1,474 | $15,409 | -- | -- |
| 2023 | $1,474 | $29,710 | $5,940 | $23,770 |
| 2022 | $1,433 | $22,110 | $4,420 | $17,690 |
| 2021 | $1,477 | $20,650 | $4,130 | $16,520 |
| 2020 | $1,453 | $18,910 | $3,780 | $15,130 |
| 2019 | $1,352 | $17,100 | $3,420 | $13,680 |
| 2018 | $1,315 | $15,600 | $3,120 | $12,480 |
| 2017 | $1,273 | $14,350 | $2,870 | $11,480 |
| 2016 | $1,281 | $13,810 | $2,760 | $11,050 |
| 2015 | $1,190 | $12,920 | $2,580 | $10,340 |
Source: Public Records
Map
Nearby Homes
- 2336 E San Tan Dr
- 2177 E Ranch Ct
- 2222 E Arabian Dr
- 2056 E San Tan Ct
- 1105 S Portland Ave
- 2062 E Arabian Dr
- 2329 E Bonita St
- 2062 E Palomino Dr
- 2516 E Camellia Dr
- 633 S Parkcrest St
- 2546 E Camellia Dr Unit 2
- 2085 E Smoke Tree Rd
- 1894 E Palomino Dr
- 1151 S Karen Ln
- 2611 E Catclaw St
- 1043 S Rockwell St
- 1140 S Rockwell St
- 2821 E Nunneley Rd
- 1792 E Appaloosa Rd
- 648 S Roanoke St
- 2277 E Ranch Rd
- 2244 E San Tan Dr
- 2254 E San Tan Dr
- 2262 E San Tan Dr
- 2287 E Ranch Rd
- 938 S Moorea Ct
- 2282 E San Tan Dr
- 2297 E Ranch Rd
- 937 S Moorea Ct
- 2296 E San Tan Dr
- 2253 E San Tan Dr
- 2243 E San Tan Dr
- 2259 E San Tan Dr
- 2307 E Ranch Rd
- 2267 E San Tan Dr
- 927 S Moorea Ct Unit WOW!!!
- 927 S Moorea Ct
- 2306 E San Tan Dr
- 2279 E San Tan Dr
- 938 S San Joaquin Ct
Your Personal Tour Guide
Ask me questions while you tour the home.