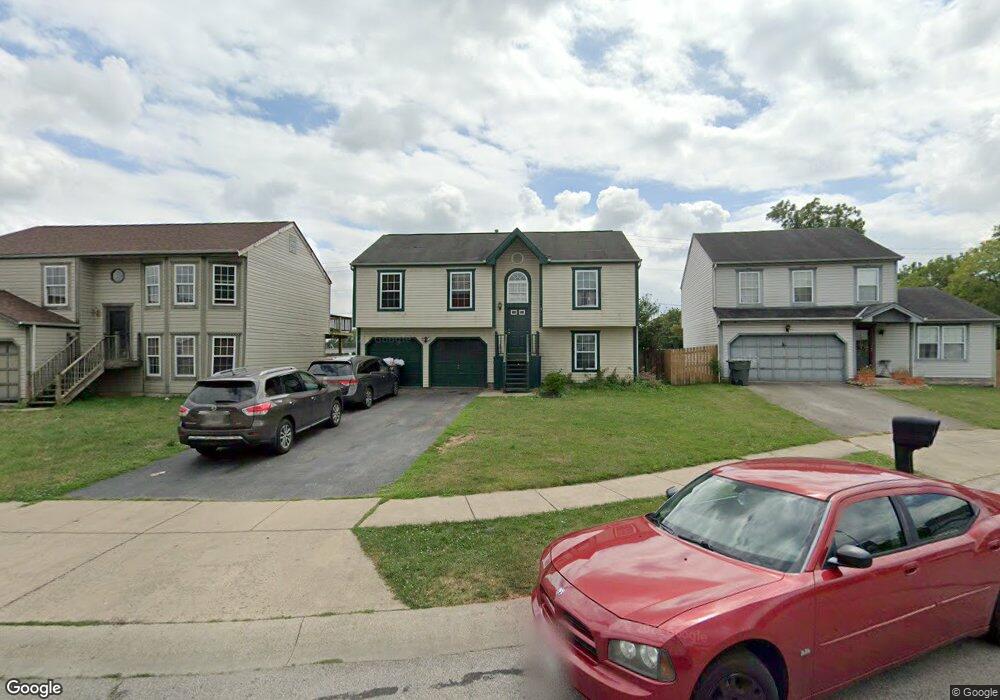
2267 Golden Leaf Ln Columbus, OH 43223
Estimated Value: $246,482 - $276,000
3
Beds
2
Baths
1,508
Sq Ft
$174/Sq Ft
Est. Value
About This Home
This home is located at 2267 Golden Leaf Ln, Columbus, OH 43223 and is currently estimated at $262,871, approximately $174 per square foot. 2267 Golden Leaf Ln is a home located in Franklin County with nearby schools including Finland Elementary School, Franklin Woods Intermediate School, and Finland Middle School.
Ownership History
Date
Name
Owned For
Owner Type
Purchase Details
Closed on
May 25, 2004
Sold by
Veazey Greg and Veazey Angela
Bought by
Velasquez Otto R
Current Estimated Value
Home Financials for this Owner
Home Financials are based on the most recent Mortgage that was taken out on this home.
Original Mortgage
$112,014
Outstanding Balance
$54,977
Interest Rate
6.06%
Mortgage Type
FHA
Estimated Equity
$207,894
Purchase Details
Closed on
Mar 13, 2000
Sold by
Mattingly William E
Bought by
Veazey Greg and Mattingly Angela
Home Financials for this Owner
Home Financials are based on the most recent Mortgage that was taken out on this home.
Original Mortgage
$77,300
Interest Rate
8.43%
Purchase Details
Closed on
Apr 19, 1996
Sold by
Bellmont Dev Corp
Bought by
Maronda Homes Inc
Create a Home Valuation Report for This Property
The Home Valuation Report is an in-depth analysis detailing your home's value as well as a comparison with similar homes in the area
Home Values in the Area
Average Home Value in this Area
Purchase History
| Date | Buyer | Sale Price | Title Company |
|---|---|---|---|
| Velasquez Otto R | $112,900 | Title First Agency Inc | |
| Veazey Greg | -- | -- | |
| Maronda Homes Inc | $149,000 | -- |
Source: Public Records
Mortgage History
| Date | Status | Borrower | Loan Amount |
|---|---|---|---|
| Open | Velasquez Otto R | $112,014 | |
| Previous Owner | Veazey Greg | $77,300 |
Source: Public Records
Tax History Compared to Growth
Tax History
| Year | Tax Paid | Tax Assessment Tax Assessment Total Assessment is a certain percentage of the fair market value that is determined by local assessors to be the total taxable value of land and additions on the property. | Land | Improvement |
|---|---|---|---|---|
| 2024 | $2,610 | $71,580 | $19,430 | $52,150 |
| 2023 | $2,564 | $71,575 | $19,425 | $52,150 |
| 2022 | $2,296 | $47,040 | $8,750 | $38,290 |
| 2021 | $2,342 | $47,040 | $8,750 | $38,290 |
| 2020 | $2,329 | $47,040 | $8,750 | $38,290 |
| 2019 | $2,127 | $37,910 | $7,000 | $30,910 |
| 2018 | $2,094 | $37,910 | $7,000 | $30,910 |
| 2017 | $2,089 | $37,910 | $7,000 | $30,910 |
| 2016 | $2,071 | $34,230 | $5,600 | $28,630 |
| 2015 | $2,071 | $34,230 | $5,600 | $28,630 |
| 2014 | $2,073 | $34,230 | $5,600 | $28,630 |
| 2013 | $1,082 | $36,015 | $5,880 | $30,135 |
Source: Public Records
Map
Nearby Homes
- 1607 Red Leaf Ln
- 1543 Red Leaf Ln
- 0 S Central Ave
- 2210 October Ridge Dr
- 1948 Big Run Bluffs Blvd
- 1949 Big Run Bluffs Blvd
- 1417 Fahy Dr
- 4745 Big Run Rd E
- 2336 Woodbrook Cir N Unit 92 B
- 2362 Woodbrook Cir N Unit 81
- 1390 Gray Meadow Dr
- 1119 Hardesty Place E Unit 1
- 2382 Hardesty Dr S Unit Q-5
- 1085 Hardesty Place E Unit 4
- 2180 Eakin Rd
- 2436 Hardesty Dr S Unit 4
- 2337 Hardesty Ct Unit 1
- 2547 Rosedale Ave
- 1994 Little Ave
- 1723 Farberdale Dr
- 2261 Golden Leaf Ln
- 2273 Golden Leaf Ln
- 2255 Golden Leaf Ln
- 2292 Golden Leaf Ln
- 2279 Golden Leaf Ln
- 2249 Golden Leaf Ln
- 2276 Golden Leaf Ln
- 2266 Golden Leaf Ln
- 2285 Golden Leaf Ln
- 2260 Golden Leaf Ln
- 2260 Golden Leaf Ln
- 2272 Golden Leaf Ln
- 2243 Golden Leaf Ln
- 2268 Golden Leaf Ln
- 2284 Golden Leaf Ln
- 2284 Golden Leaf Ln
- 2254 Golden Leaf Ln
- 2278 Golden Leaf Ln
- 2248 Golden Leaf Ln
- 2237 Golden Leaf Ln