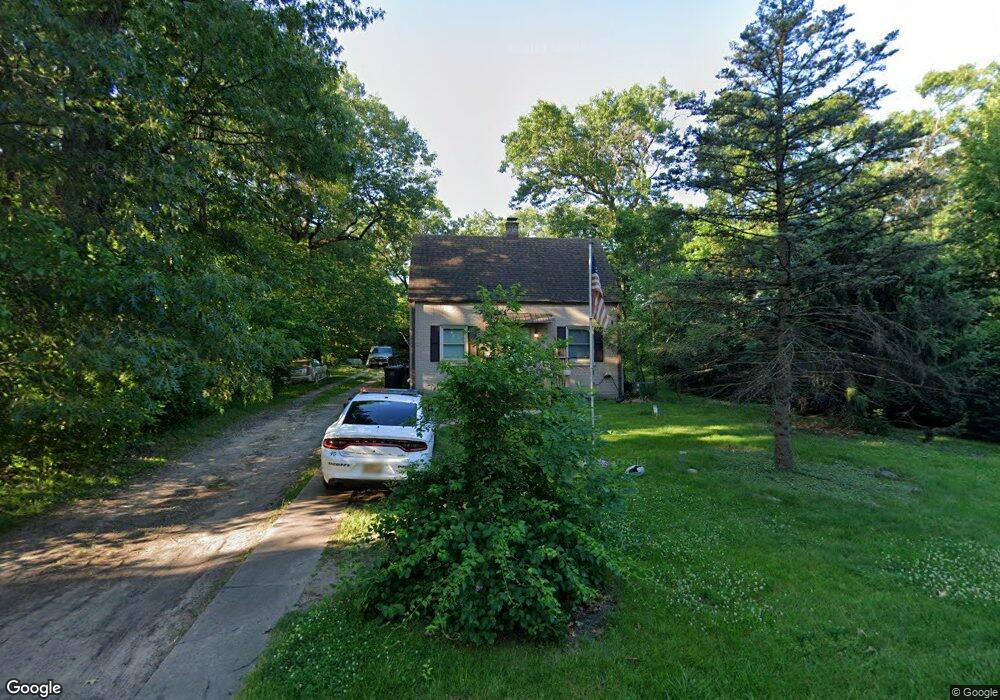
2267 Ranburn Dr Gary, IN 46408
Ross NeighborhoodEstimated Value: $171,000 - $226,000
2
Beds
2
Baths
2,016
Sq Ft
$94/Sq Ft
Est. Value
About This Home
This home is located at 2267 Ranburn Dr, Gary, IN 46408 and is currently estimated at $188,973, approximately $93 per square foot. 2267 Ranburn Dr is a home located in Lake County with nearby schools including Calumet High School, Steel City Academy, and Ambassador Academy.
Ownership History
Date
Name
Owned For
Owner Type
Purchase Details
Closed on
Sep 27, 2018
Sold by
2267 Ranburn Drive Land Trust
Bought by
Mueller Robert B and Mueller Diana L
Current Estimated Value
Purchase Details
Closed on
Feb 9, 2018
Sold by
Housemart Inc
Bought by
2267 Ranburn Drive Land Trust
Purchase Details
Closed on
Aug 4, 2017
Sold by
Jeeninga John D and Jeeninga Nancy
Bought by
Housemart Inc
Create a Home Valuation Report for This Property
The Home Valuation Report is an in-depth analysis detailing your home's value as well as a comparison with similar homes in the area
Home Values in the Area
Average Home Value in this Area
Purchase History
| Date | Buyer | Sale Price | Title Company |
|---|---|---|---|
| Mueller Robert B | -- | Indiana Title Network Co | |
| 2267 Ranburn Drive Land Trust | -- | Indiana Title Network Co | |
| Housemart Inc | $28,001 | Indiana Title Network Co |
Source: Public Records
Tax History
| Year | Tax Paid | Tax Assessment Tax Assessment Total Assessment is a certain percentage of the fair market value that is determined by local assessors to be the total taxable value of land and additions on the property. | Land | Improvement |
|---|---|---|---|---|
| 2025 | $1,912 | $166,300 | $26,800 | $139,500 |
| 2024 | $3,847 | $93,100 | $27,800 | $65,300 |
| 2023 | $1,725 | $90,300 | $27,800 | $62,500 |
| 2022 | $1,725 | $85,500 | $27,700 | $57,800 |
| 2021 | $1,629 | $80,800 | $27,700 | $53,100 |
| 2020 | $1,649 | $81,800 | $27,700 | $54,100 |
| 2019 | $1,625 | $76,400 | $26,000 | $50,400 |
| 2018 | $2,334 | $78,200 | $26,600 | $51,600 |
| 2017 | $840 | $79,100 | $26,600 | $52,500 |
| 2016 | $1,467 | $107,900 | $26,600 | $81,300 |
| 2014 | $1,272 | $108,700 | $27,400 | $81,300 |
| 2013 | $1,138 | $106,000 | $27,400 | $78,600 |
Source: Public Records
Map
Nearby Homes
- 4300 Roosevelt Place
- 4177 Oak Ln
- 4056 Cleveland St
- 3825 Taft St
- 4055 Marshall Place
- 2725 W 42nd Ave
- 1645 W 40th Ave
- 4401 W Taft St
- 3701 Grant St
- 3816 Lincoln St
- 4301 Johnson St
- 1301 W Ridge Rd
- 3940 Pierce St
- 3636 Lincoln St
- 4034 Fillmore St
- 3679 Buchanan St
- 4181 Fillmore St
- 4673 Arthur St
- 4017 Polk St
- 3213 W 46th Appr Ave
- 2283 Ranburn Dr
- 2251 Ranburn Dr
- 2272 W 41st Ave
- 2301 Ranburn Dr
- 2235 Ranburn Dr
- 2258 W 41st Ave
- 2300 W 41st Ave
- 2270 Ranburn Dr
- 2280 Ranburn Dr
- 2240 W 41st Ave
- 2248 Ranburn Dr
- 2321 Ranburn Dr
- 2300 Ranburn Dr
- 2236 Ranburn Dr
- 2217 Ranburn Dr
- 2340 W 41st Ave
- 2341 Ranburn Dr
- 2216 W 41st Ave
- 2220 Ranburn Dr
- 2271 W 41st Ave
Your Personal Tour Guide
Ask me questions while you tour the home.