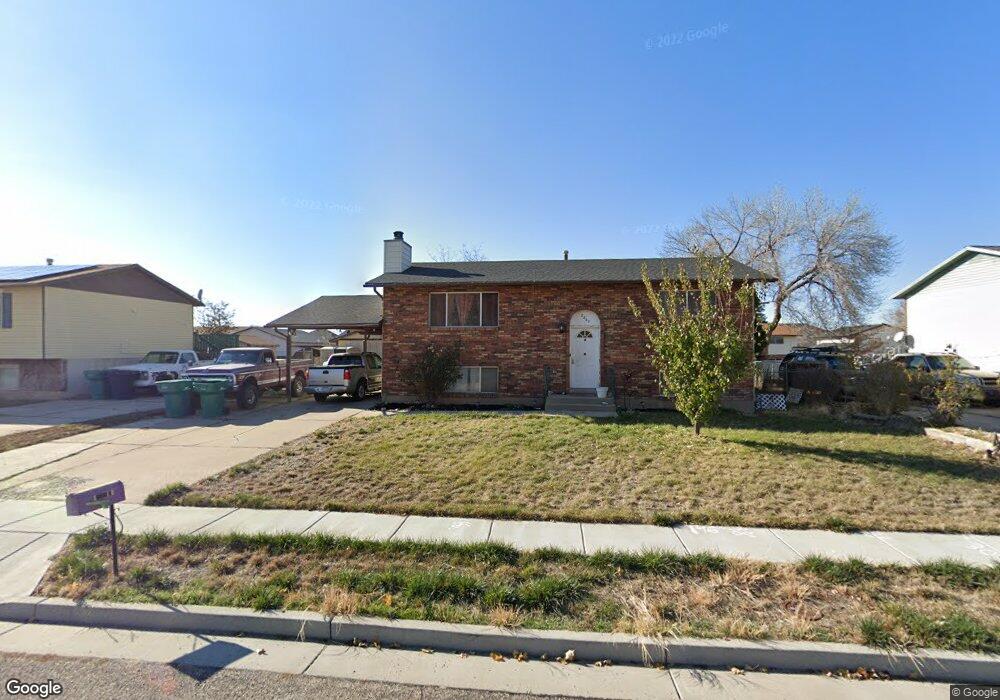
2267 S 450 W Clearfield, UT 84015
Estimated Value: $392,000 - $422,520
4
Beds
2
Baths
1,960
Sq Ft
$206/Sq Ft
Est. Value
About This Home
This home is located at 2267 S 450 W, Clearfield, UT 84015 and is currently estimated at $403,380, approximately $205 per square foot. 2267 S 450 W is a home located in Davis County with nearby schools including Antelope Elementary School, North Davis Junior High School, and Clearfield High School.
Ownership History
Date
Name
Owned For
Owner Type
Purchase Details
Closed on
Mar 26, 2009
Sold by
Thomson Carolyn B
Bought by
Thomson Carolyn B
Current Estimated Value
Home Financials for this Owner
Home Financials are based on the most recent Mortgage that was taken out on this home.
Original Mortgage
$112,348
Outstanding Balance
$71,207
Interest Rate
5.15%
Mortgage Type
FHA
Estimated Equity
$332,173
Purchase Details
Closed on
Oct 1, 2003
Sold by
Casper Nicholas Tam and Casper Patricia Ann
Bought by
Thomson Carolyn B
Home Financials for this Owner
Home Financials are based on the most recent Mortgage that was taken out on this home.
Original Mortgage
$110,269
Interest Rate
6.4%
Mortgage Type
FHA
Create a Home Valuation Report for This Property
The Home Valuation Report is an in-depth analysis detailing your home's value as well as a comparison with similar homes in the area
Home Values in the Area
Average Home Value in this Area
Purchase History
| Date | Buyer | Sale Price | Title Company |
|---|---|---|---|
| Thomson Carolyn | -- | None Listed On Document | |
| Thomson Carolyn B | -- | Utah Commercial Title Co | |
| Thomson Carolyn B | -- | Founders Title Co |
Source: Public Records
Mortgage History
| Date | Status | Borrower | Loan Amount |
|---|---|---|---|
| Previous Owner | Thomson Carolyn B | $112,348 | |
| Previous Owner | Thomson Carolyn B | $110,269 |
Source: Public Records
Tax History Compared to Growth
Tax History
| Year | Tax Paid | Tax Assessment Tax Assessment Total Assessment is a certain percentage of the fair market value that is determined by local assessors to be the total taxable value of land and additions on the property. | Land | Improvement |
|---|---|---|---|---|
| 2025 | $2,369 | $212,300 | $72,093 | $140,207 |
| 2024 | $2,297 | $207,350 | $68,925 | $138,425 |
| 2023 | $2,106 | $349,000 | $110,323 | $238,677 |
| 2022 | $2,130 | $190,850 | $63,209 | $127,641 |
| 2021 | $1,854 | $251,000 | $67,057 | $183,943 |
| 2020 | $1,614 | $217,000 | $56,367 | $160,633 |
| 2019 | $1,560 | $207,000 | $59,172 | $147,828 |
| 2018 | $1,400 | $181,000 | $52,521 | $128,479 |
| 2016 | $1,106 | $74,745 | $20,970 | $53,775 |
| 2015 | $1,049 | $67,650 | $20,970 | $46,680 |
| 2014 | $1,019 | $66,562 | $20,970 | $45,592 |
| 2013 | -- | $54,439 | $23,653 | $30,786 |
Source: Public Records
Map
Nearby Homes