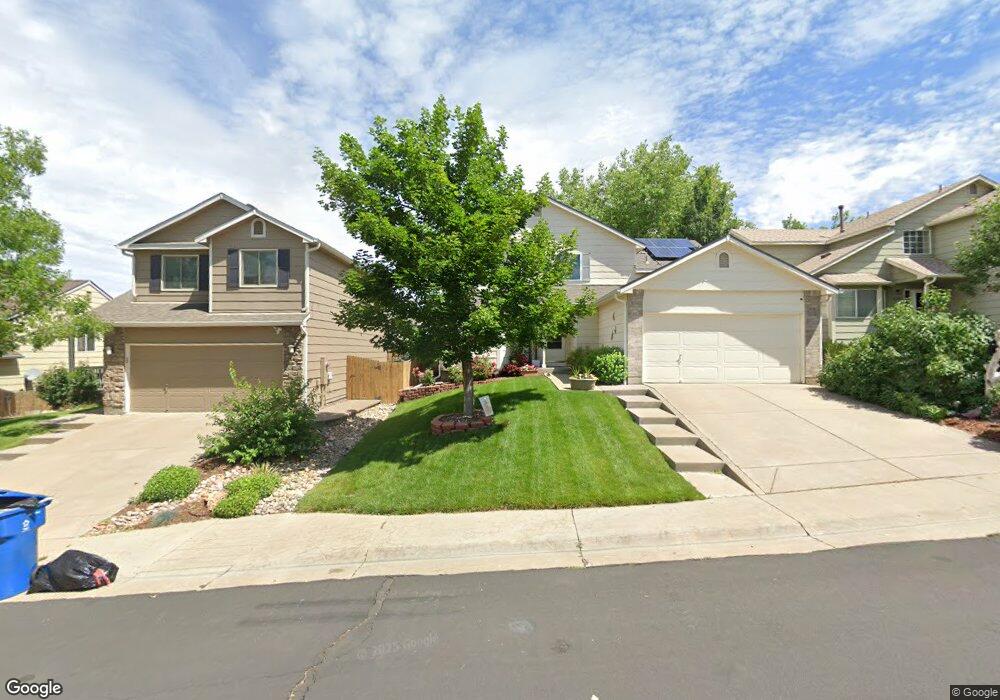
22673 E Belleview Place Aurora, CO 80015
Saddle Rock Ridge NeighborhoodEstimated Value: $497,000 - $535,000
3
Beds
4
Baths
1,496
Sq Ft
$345/Sq Ft
Est. Value
About This Home
This home is located at 22673 E Belleview Place, Aurora, CO 80015 and is currently estimated at $515,617, approximately $344 per square foot. 22673 E Belleview Place is a home located in Arapahoe County with nearby schools including Antelope Ridge Elementary School, Thunder Ridge Middle School, and Eaglecrest High School.
Ownership History
Date
Name
Owned For
Owner Type
Purchase Details
Closed on
Dec 20, 2007
Sold by
Spina Scott A
Bought by
Spina Scott A and Spina Brandy
Current Estimated Value
Home Financials for this Owner
Home Financials are based on the most recent Mortgage that was taken out on this home.
Original Mortgage
$285,014
Outstanding Balance
$177,563
Interest Rate
6.26%
Mortgage Type
New Conventional
Estimated Equity
$338,054
Purchase Details
Closed on
Nov 24, 1999
Sold by
Melody Homes Inc
Bought by
Spina Scott A
Home Financials for this Owner
Home Financials are based on the most recent Mortgage that was taken out on this home.
Original Mortgage
$149,350
Interest Rate
7.88%
Create a Home Valuation Report for This Property
The Home Valuation Report is an in-depth analysis detailing your home's value as well as a comparison with similar homes in the area
Home Values in the Area
Average Home Value in this Area
Purchase History
| Date | Buyer | Sale Price | Title Company |
|---|---|---|---|
| Spina Scott A | -- | Security Title | |
| Spina Scott A | $175,756 | Land Title |
Source: Public Records
Mortgage History
| Date | Status | Borrower | Loan Amount |
|---|---|---|---|
| Open | Spina Scott A | $285,014 | |
| Closed | Spina Scott A | $149,350 |
Source: Public Records
Tax History
| Year | Tax Paid | Tax Assessment Tax Assessment Total Assessment is a certain percentage of the fair market value that is determined by local assessors to be the total taxable value of land and additions on the property. | Land | Improvement |
|---|---|---|---|---|
| 2025 | $4,074 | $35,176 | -- | -- |
| 2024 | $3,660 | $35,470 | -- | -- |
| 2023 | $3,205 | $35,470 | $0 | $0 |
| 2022 | $3,205 | $27,779 | $0 | $0 |
| 2021 | $3,229 | $27,779 | $0 | $0 |
| 2020 | $3,039 | $26,677 | $0 | $0 |
| 2019 | $2,948 | $26,677 | $0 | $0 |
| 2018 | $2,861 | $23,530 | $0 | $0 |
| 2017 | $2,820 | $23,530 | $0 | $0 |
| 2016 | $2,535 | $20,162 | $0 | $0 |
| 2015 | $2,458 | $20,162 | $0 | $0 |
| 2014 | $1,936 | $14,551 | $0 | $0 |
| 2013 | -- | $16,220 | $0 | $0 |
Source: Public Records
Map
Nearby Homes
- 22501 E Belleview Place
- 5060 S Ukraine St
- 5090 S Wenatchee Cir
- 22894 E Progress Ave
- 22286 E Belleview Ln
- 5014 S Shawnee St
- 22153 E Belleview Ln
- 5361 S Ukraine Way
- 4830 S Versailles St
- 22822 E Union Cir
- 5247 S Riviera Cir
- 5450 S Valdai St
- 5435 S Shawnee Way
- 5453 S Sicily St
- 4877 S Algonquian Way
- 23372 E Chenango Place
- 4927 S Addison Way
- 5466 S Shawnee Way
- 23341 E Saratoga Cir
- 23492 E Chenango Place
- 22653 E Belleview Place
- 22693 E Belleview Place
- 22633 E Belleview Place
- 22715 E Belleview Pl
- 5105 S Valdai St
- 22735 E Belleview Place
- 22613 E Belleview Place
- 5106 S Valdai St
- 22755 E Belleview Place
- 5116 S Valdai St
- 22591 E Belleview Place
- 5104 S Ukraine St
- 22632 E Bellewood Dr
- 22612 E Bellewood Dr
- 22652 E Bellewood Dr
- 5107 S Versailles St
- 22590 E Bellewood Dr
- 5125 S Valdai St
- 22775 E Belleview Place
- 5126 S Valdai St
Your Personal Tour Guide
Ask me questions while you tour the home.