2268 Carroll Eastern Rd NW Lancaster, OH 43130
Estimated Value: $607,000 - $695,402
4
Beds
3
Baths
2,864
Sq Ft
$224/Sq Ft
Est. Value
About This Home
This home is located at 2268 Carroll Eastern Rd NW, Lancaster, OH 43130 and is currently estimated at $640,351, approximately $223 per square foot. 2268 Carroll Eastern Rd NW is a home located in Fairfield County with nearby schools including Bloom Carroll Primary School, Bloom Carroll Intermediate School, and Bloom-Carroll Middle School.
Ownership History
Date
Name
Owned For
Owner Type
Purchase Details
Closed on
Nov 30, 2009
Sold by
Gang Michael J
Bought by
Killoran Timothy J and Miller Melinda A
Current Estimated Value
Home Financials for this Owner
Home Financials are based on the most recent Mortgage that was taken out on this home.
Original Mortgage
$220,000
Outstanding Balance
$142,119
Interest Rate
5.11%
Mortgage Type
Purchase Money Mortgage
Estimated Equity
$498,232
Purchase Details
Closed on
Jun 27, 2005
Sold by
Yeamans Marcy
Bought by
Gang Michael J
Home Financials for this Owner
Home Financials are based on the most recent Mortgage that was taken out on this home.
Original Mortgage
$67,500
Interest Rate
8.12%
Mortgage Type
Fannie Mae Freddie Mac
Purchase Details
Closed on
Sep 10, 1992
Create a Home Valuation Report for This Property
The Home Valuation Report is an in-depth analysis detailing your home's value as well as a comparison with similar homes in the area
Purchase History
| Date | Buyer | Sale Price | Title Company |
|---|---|---|---|
| Killoran Timothy J | $275,000 | Amerititle East | |
| Gang Michael J | $75,000 | -- | |
| -- | $16,900 | -- |
Source: Public Records
Mortgage History
| Date | Status | Borrower | Loan Amount |
|---|---|---|---|
| Open | Killoran Timothy J | $220,000 | |
| Closed | Gang Michael J | $67,500 |
Source: Public Records
Tax History
| Year | Tax Paid | Tax Assessment Tax Assessment Total Assessment is a certain percentage of the fair market value that is determined by local assessors to be the total taxable value of land and additions on the property. | Land | Improvement |
|---|---|---|---|---|
| 2025 | $14,390 | $226,990 | $65,100 | $161,890 |
| 2024 | $14,390 | $178,310 | $47,500 | $130,810 |
| 2023 | $7,816 | $178,310 | $47,500 | $130,810 |
| 2022 | $7,872 | $178,310 | $47,500 | $130,810 |
| 2021 | $6,243 | $138,610 | $39,590 | $99,020 |
| 2020 | $6,318 | $138,610 | $39,590 | $99,020 |
| 2019 | $6,344 | $138,610 | $39,590 | $99,020 |
| 2018 | $5,101 | $105,950 | $27,470 | $78,480 |
| 2017 | $4,788 | $114,470 | $27,470 | $87,000 |
| 2016 | $4,282 | $105,720 | $27,470 | $78,250 |
| 2015 | $4,109 | $98,750 | $27,470 | $71,280 |
| 2014 | $3,928 | $98,750 | $27,470 | $71,280 |
| 2013 | $3,928 | $98,750 | $27,470 | $71,280 |
Source: Public Records
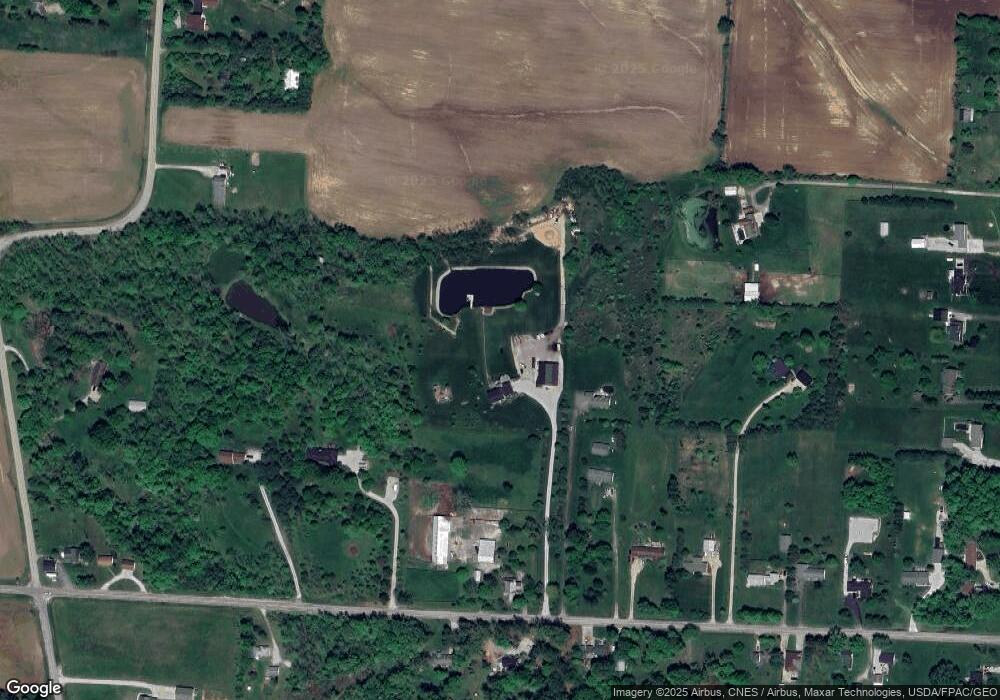
Map
Nearby Homes
- 4315 Brook Rd NW
- 5870 Brook Rd NW
- 4600 Sheets Rd NW
- 2270 Ginder Rd NW
- 1800 Ginder Rd NW
- 1577 Winding Oak Dr NW
- 3340 Election House Rd NW
- 3485 Lancaster-Kirkersville Rd NW
- 4645 Meadow Grove Dr NW
- 2927 Lancaster-Kirkersville Rd NW
- Lot 18A S Creekview Ct
- 112 N Creekview Ct
- 7836 Basil Rd NW
- 0 Fremar Rd NE Unit Lot1 225007256
- 2665 Cross Creek Ave
- 61 Highland St
- 2684 Two Ridge Ave
- 2560 Fox Trail Dr
- 850 Marquette Dr NE
- 2645 Little Pine Ln
- 2280 Carroll Eastern Rd NW
- 2285 Carroll Eastern Rd NW
- 2230 Carroll Eastern Rd NW
- 2235 Carroll Eastern Rd NW
- 2204 Carroll Eastern Rd NW
- 2315 Carroll Eastern Rd NW
- 2326 Carroll Eastern Rd NW
- 2178 Carroll Eastern Rd NW
- 2160 Carroll Eastern Rd NW
- 2135 Carroll Eastern Rd NW
- 2140 Carroll Eastern Rd NW
- 2179 Carroll Eastern Rd NW
- 2364 Carroll Eastern Rd NW
- 2112 Carroll Eastern Rd NW
- 2113 Carroll Southern Rd
- 4768 Election House Rd NW
- 2415 Carroll Eastern Rd NW
- 2085 Carroll Eastern Rd NW
- 2082 Carroll Eastern Rd NW
- 2065 Carroll Eastern Rd NW
Your Personal Tour Guide
Ask me questions while you tour the home.