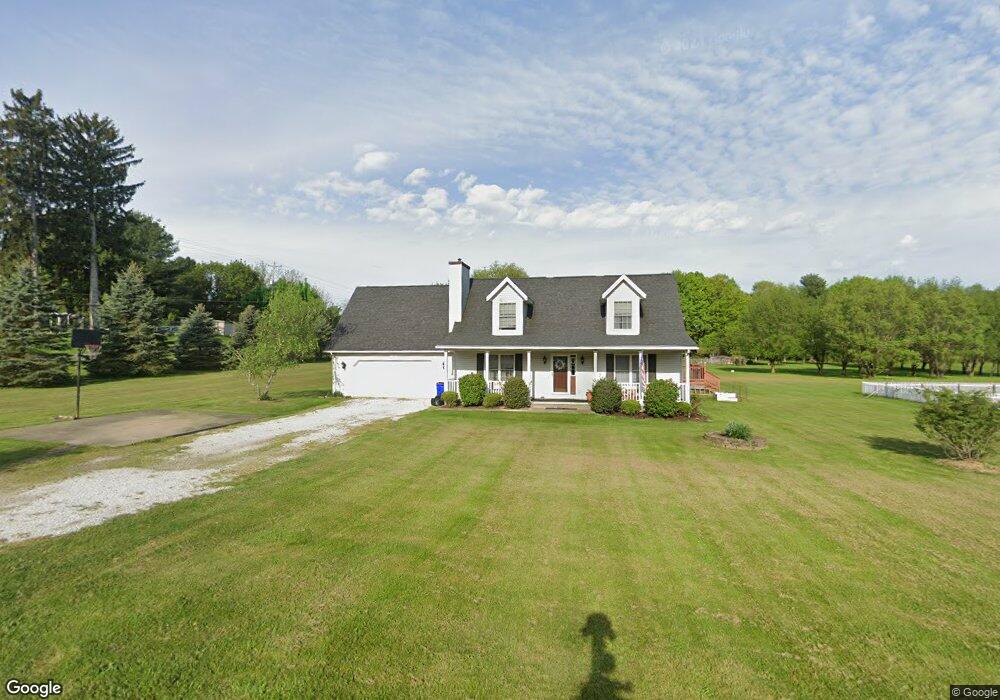
2269 Congress Lake Rd Mogadore, OH 44260
Estimated Value: $276,000 - $388,000
3
Beds
3
Baths
1,630
Sq Ft
$202/Sq Ft
Est. Value
About This Home
This home is located at 2269 Congress Lake Rd, Mogadore, OH 44260 and is currently estimated at $329,365, approximately $202 per square foot. 2269 Congress Lake Rd is a home located in Portage County with nearby schools including Suffield Elementary School, Field Middle School, and Field High School.
Ownership History
Date
Name
Owned For
Owner Type
Purchase Details
Closed on
Jan 9, 2013
Sold by
Harmon John W and Harmon Rebecca A
Bought by
Harmon John W and Harmon Rebecca A
Current Estimated Value
Purchase Details
Closed on
Jun 15, 2007
Sold by
Demboski Daniel J and Demboski Jennifer M
Bought by
Harmon John W and Harmon Rebecca A
Home Financials for this Owner
Home Financials are based on the most recent Mortgage that was taken out on this home.
Original Mortgage
$139,600
Interest Rate
6.38%
Mortgage Type
Purchase Money Mortgage
Purchase Details
Closed on
Jul 30, 2002
Sold by
Frakes Marlin and Brown Edward
Bought by
Demboski Daniel J and Demboski Jennifer M
Home Financials for this Owner
Home Financials are based on the most recent Mortgage that was taken out on this home.
Original Mortgage
$162,550
Interest Rate
6.7%
Purchase Details
Closed on
Jun 19, 2001
Sold by
Mid Ohio Securities Corp and Fbo Kenneth P Robb
Bought by
Frakes Marlon and Brown Edward
Create a Home Valuation Report for This Property
The Home Valuation Report is an in-depth analysis detailing your home's value as well as a comparison with similar homes in the area
Home Values in the Area
Average Home Value in this Area
Purchase History
| Date | Buyer | Sale Price | Title Company |
|---|---|---|---|
| Harmon John W | -- | First Security Title | |
| Harmon John W | $174,500 | Fidelity | |
| Demboski Daniel J | $167,600 | Endress/Lawyers Title | |
| Frakes Marlon | -- | -- |
Source: Public Records
Mortgage History
| Date | Status | Borrower | Loan Amount |
|---|---|---|---|
| Previous Owner | Harmon John W | $139,600 | |
| Previous Owner | Demboski Daniel J | $162,550 |
Source: Public Records
Tax History Compared to Growth
Tax History
| Year | Tax Paid | Tax Assessment Tax Assessment Total Assessment is a certain percentage of the fair market value that is determined by local assessors to be the total taxable value of land and additions on the property. | Land | Improvement |
|---|---|---|---|---|
| 2024 | $4,146 | $104,690 | $14,810 | $89,880 |
| 2023 | $3,855 | $79,460 | $11,450 | $68,010 |
| 2022 | $3,858 | $79,460 | $11,450 | $68,010 |
| 2021 | $3,849 | $79,460 | $11,450 | $68,010 |
| 2020 | $3,609 | $67,660 | $11,450 | $56,210 |
| 2019 | $3,624 | $67,660 | $11,450 | $56,210 |
| 2018 | $2,535 | $56,640 | $12,570 | $44,070 |
| 2017 | $2,535 | $56,640 | $12,570 | $44,070 |
| 2016 | $2,517 | $56,640 | $12,570 | $44,070 |
| 2015 | $2,519 | $56,640 | $12,570 | $44,070 |
| 2014 | $2,451 | $56,640 | $12,570 | $44,070 |
| 2013 | $2,430 | $56,640 | $12,570 | $44,070 |
Source: Public Records
Map
Nearby Homes
- 1811 Randolph Rd
- 0 Randolph Rd Unit 5112744
- 1195 Etter Rd
- 3241 State Route 43
- 2824 Saxe Rd
- 2516 Ranfield Rd
- 1369 S Polen Ave
- 1707 Old Forge Rd
- 596 Ticknor Rd
- 3434 Lawndale Dr
- 1330 Highpoint St
- 2835 Sunnybrook Rd
- S/L 11 959 Sunrise Dr
- S/L 38 1150 Lakeview Dr
- S/L 37 1140 Lakeview Dr
- 3672 Elmhurst Ct
- 3579 Elmhurst Ct
- 1418 Arcadia Rd
- VL 863 State Route 43
- 268 Randolph Rd
- 1749 Randolph Rd
- 2293 Congress Lake Rd
- 2243 Congress Lake Rd
- 1792 Randolph Rd
- 1733 Randolph Rd
- 1814 Randolph Rd
- 2309 Congress Lake Rd
- 1721 Randolph Rd
- 2310 Congress Lake Rd
- 2319 Congress Lake Rd
- 2320 Congress Lake Rd
- 2330 Congress Lake Rd
- 1845 Randolph Rd
- 2331 Congress Lake Rd
- 2196 Congress Lake Rd
- 2342 Congress Lake Rd
- 2289 N Fairway Cir
- 1854 Randolph Rd
- 2355 Congress Lake Rd
- 2346 Congress Lake Rd