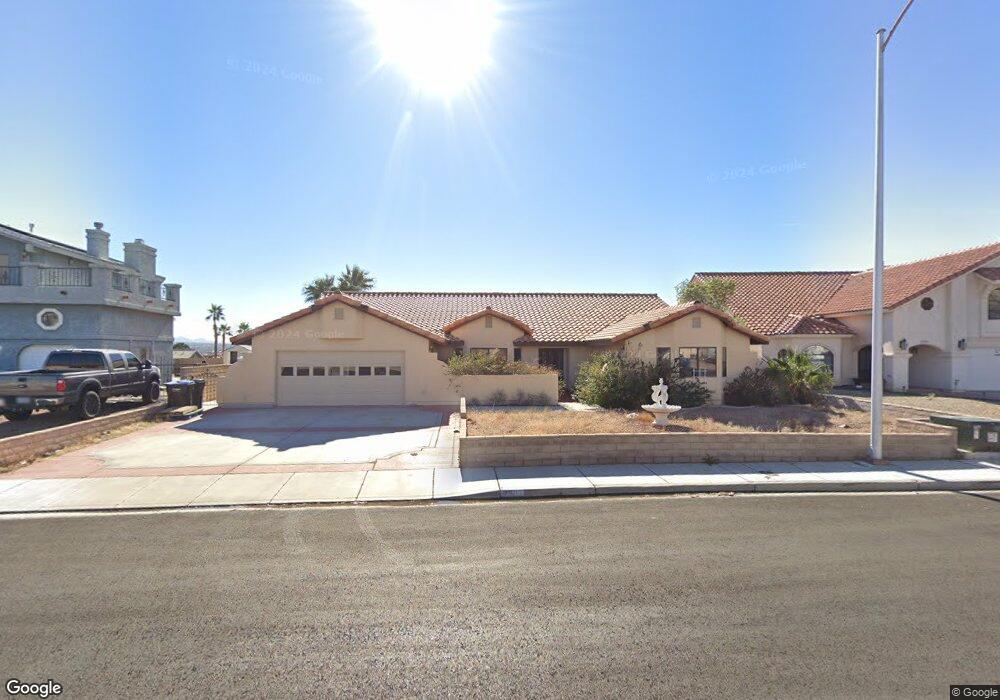
2269 Kevin Cir Laughlin, NV 89029
Estimated Value: $400,024 - $458,000
3
Beds
2
Baths
2,403
Sq Ft
$175/Sq Ft
Est. Value
About This Home
This home is located at 2269 Kevin Cir, Laughlin, NV 89029 and is currently estimated at $419,506, approximately $174 per square foot. 2269 Kevin Cir is a home located in Clark County with nearby schools including William G. Bennett Elementary School and Laughlin Junior/Senior High School.
Ownership History
Date
Name
Owned For
Owner Type
Purchase Details
Closed on
Aug 8, 2019
Sold by
Ledford Harold R and Ledford Judy K
Bought by
Barbarita Kevin Anthony and Barbarita Colleen Catherine
Current Estimated Value
Purchase Details
Closed on
Aug 30, 2010
Sold by
Malroy Mary L
Bought by
Ledford Harold R and Ledford Judy K
Home Financials for this Owner
Home Financials are based on the most recent Mortgage that was taken out on this home.
Original Mortgage
$192,408
Interest Rate
4.75%
Mortgage Type
FHA
Purchase Details
Closed on
Dec 2, 1996
Sold by
Hamilton Richard Orville and Hamilton Sylvia Ann
Bought by
Malroy Mary L
Home Financials for this Owner
Home Financials are based on the most recent Mortgage that was taken out on this home.
Original Mortgage
$128,000
Interest Rate
7.75%
Create a Home Valuation Report for This Property
The Home Valuation Report is an in-depth analysis detailing your home's value as well as a comparison with similar homes in the area
Home Values in the Area
Average Home Value in this Area
Purchase History
| Date | Buyer | Sale Price | Title Company |
|---|---|---|---|
| Barbarita Kevin Anthony | $160,800 | None Available | |
| Ledford Harold R | $195,000 | Chicago Title Las Vegas | |
| Malroy Mary L | $160,000 | Land Title |
Source: Public Records
Mortgage History
| Date | Status | Borrower | Loan Amount |
|---|---|---|---|
| Previous Owner | Ledford Harold R | $192,408 | |
| Previous Owner | Malroy Mary L | $128,000 |
Source: Public Records
Tax History Compared to Growth
Tax History
| Year | Tax Paid | Tax Assessment Tax Assessment Total Assessment is a certain percentage of the fair market value that is determined by local assessors to be the total taxable value of land and additions on the property. | Land | Improvement |
|---|---|---|---|---|
| 2025 | $3,068 | $89,359 | $21,000 | $68,359 |
| 2024 | $2,949 | $89,359 | $21,000 | $68,359 |
| 2023 | $2,949 | $97,861 | $31,500 | $66,361 |
| 2022 | $2,731 | $83,534 | $22,400 | $61,134 |
| 2021 | $2,529 | $81,161 | $22,400 | $58,761 |
| 2020 | $2,346 | $81,062 | $22,400 | $58,662 |
| 2019 | $2,199 | $78,921 | $20,650 | $58,271 |
| 2018 | $2,098 | $75,821 | $19,250 | $56,571 |
| 2017 | $2,534 | $75,681 | $17,850 | $57,831 |
| 2016 | $2,014 | $68,373 | $12,950 | $55,423 |
| 2015 | $1,958 | $70,187 | $14,000 | $56,187 |
| 2014 | $1,898 | $58,904 | $14,000 | $44,904 |
Source: Public Records
Map
Nearby Homes
- 3640 Catalina Dr
- 3637 Cottage Stream Ct
- 3791 Desert Marina Dr Unit 109
- 3791 Desert Marina Dr Unit 118
- 3771 Desert Marina Dr Unit 87
- 3771 Desert Marina Dr Unit 95
- 3761 Desert Marina Dr Unit 74
- 3811 Desert Marina Dr Unit 125
- 3811 Desert Marina Dr Unit 126
- 3740 Desert Marina Dr Unit 2
- 3740 Desert Marina Dr Unit 12
- 3859 Desert Marina Dr Unit 257
- 3597 Cottage Wood St
- 3730 Desert Marina Dr Unit 16
- 3730 Desert Marina Dr Unit 17
- 3819 Desert Marina Dr Unit 205
- 3720 Desert Marina Dr Unit 33
- 3720 Desert Marina Dr Unit 29
- 3720 Desert Marina Dr Unit 32
- 3780 Desert Marina Dr Unit 134
- 2257 Kevin Cir
- 2281 Kevin Cir
- 2256 River City Dr
- 2268 River City Dr
- 2244 River City Dr
- 2280 River City Dr
- 2258 Kevin Cir
- 2293 Kevin Cir
- 3677 Laughlin Blvd
- 3657 Laughlin Blvd
- 3687 Laughlin Blvd
- 2294 Kevin Cir
- 2292 River City Dr
- 3697 Laughlin Blvd
- 2270 Kevin Cir
- 2282 Kevin Cir
- 3647 Laughlin Blvd
- 2255 River City Dr
- 3712 Westcliff Ave
- 2267 River City Dr