Estimated Value: $180,000 - $289,000
2
Beds
1
Bath
725
Sq Ft
$326/Sq Ft
Est. Value
About This Home
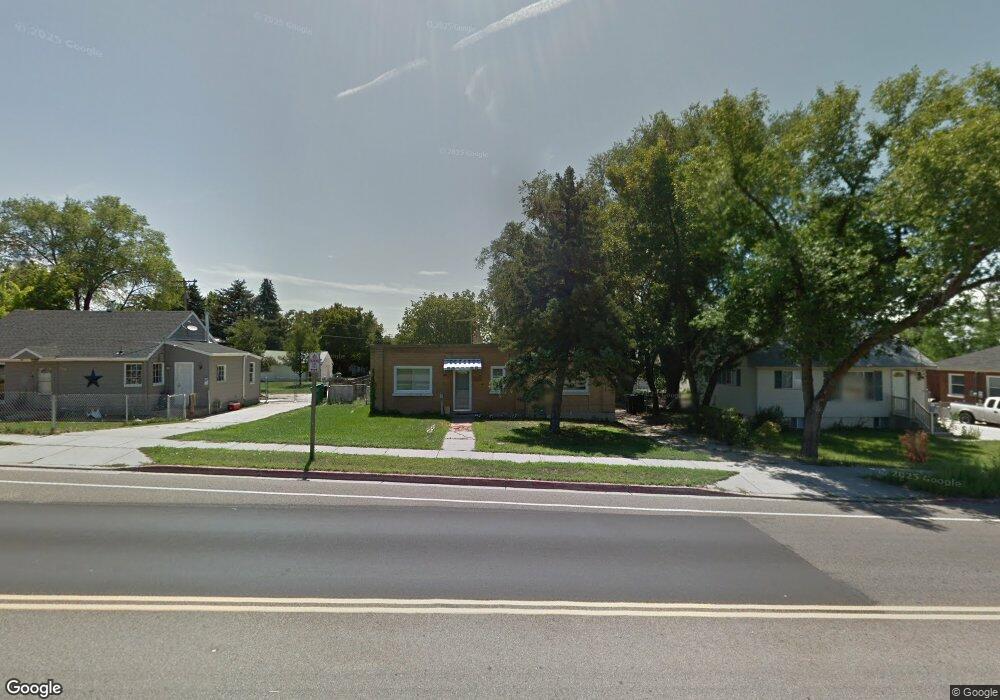
This home is located at 2269 W 5600 S, Roy, UT 84067 and is currently estimated at $236,667, approximately $326 per square foot. 2269 W 5600 S is a home located in Weber County with nearby schools including Municipal School, Roy Junior High School, and Roy High School.
Ownership History
Date
Name
Owned For
Owner Type
Purchase Details
Closed on
Jan 18, 2023
Sold by
Parks Chad
Bought by
Utah Department Of Transportation
Current Estimated Value
Purchase Details
Closed on
Apr 20, 2021
Sold by
Home Options Llc
Bought by
Parks Chad
Home Financials for this Owner
Home Financials are based on the most recent Mortgage that was taken out on this home.
Original Mortgage
$168,000
Interest Rate
3.05%
Mortgage Type
New Conventional
Purchase Details
Closed on
Dec 17, 2012
Sold by
Parks Chad
Bought by
Home Options Llc
Purchase Details
Closed on
Aug 26, 2003
Sold by
Benavides Randy R
Bought by
Benavides Randy R and Benavides Lydia C
Home Financials for this Owner
Home Financials are based on the most recent Mortgage that was taken out on this home.
Original Mortgage
$43,000
Interest Rate
5.87%
Mortgage Type
Purchase Money Mortgage
Purchase Details
Closed on
Dec 1, 1983
Sold by
Hicks Ruth M
Bought by
Benavides Randy R
Create a Home Valuation Report for This Property
The Home Valuation Report is an in-depth analysis detailing your home's value as well as a comparison with similar homes in the area
Home Values in the Area
Average Home Value in this Area
Purchase History
| Date | Buyer | Sale Price | Title Company |
|---|---|---|---|
| Utah Department Of Transportation | -- | None Listed On Document | |
| Parks Chad | -- | Us Title Ins Agency | |
| Home Options Llc | -- | First American Title Company | |
| Parks Chad | -- | First American Title Company | |
| Benavides Randy R | -- | First American Title | |
| Benavides Randy R | -- | -- |
Source: Public Records
Mortgage History
| Date | Status | Borrower | Loan Amount |
|---|---|---|---|
| Previous Owner | Parks Chad | $168,000 | |
| Previous Owner | Benavides Randy R | $43,000 |
Source: Public Records
Tax History Compared to Growth
Tax History
| Year | Tax Paid | Tax Assessment Tax Assessment Total Assessment is a certain percentage of the fair market value that is determined by local assessors to be the total taxable value of land and additions on the property. | Land | Improvement |
|---|---|---|---|---|
| 2025 | $265 | $106,250 | $106,250 | $0 |
| 2024 | $259 | $106,263 | $106,263 | $0 |
| 2023 | $395 | $171,703 | $97,600 | $74,103 |
| 2022 | $1,651 | $141,899 | $46,752 | $95,147 |
| 2021 | $1,290 | $179,000 | $59,495 | $119,505 |
| 2020 | $1,194 | $152,000 | $59,495 | $92,505 |
| 2019 | $1,120 | $133,002 | $34,014 | $98,988 |
| 2018 | $967 | $105,000 | $32,304 | $72,696 |
| 2017 | $889 | $89,000 | $32,592 | $56,408 |
| 2016 | $862 | $46,264 | $15,962 | $30,302 |
| 2015 | $776 | $41,798 | $15,962 | $25,836 |
| 2014 | $690 | $35,411 | $15,962 | $19,449 |
Source: Public Records
Map
Nearby Homes
- 5643 S 2200 W
- 2146 W 5600 S Unit 29
- 2184 W 5500 S
- 5545 S 2100 W Unit 12
- 5545 S 2100 W Unit 20
- 5545 S 2100 W Unit D22
- 5810 S 2550 W
- 5333 S 2200 W
- 5345 S 2425 W
- 2571 W 5725 S
- 2587 W 5750 S
- 5289 S 2200 W
- 2646 W 5625 S Unit M-2646
- 5261 S 2200 W
- 5326 S 2675 W
- 2672 W 5750 S
- 5317 S 2690 W
- 5185 S 2100 W
- 480 W 2650 N
- 484 W 2650 N
- 2257 W 5600 S
- 2279 W 5600 S
- 2279 W 5600 S Unit 16
- 2251 W 5600 S
- 2289 W 5600 S
- 5630 S 2300 W
- 2258 W 5600 S Unit REAR
- 2258 W 5600 S Unit FRONT
- 2235 W 5600 S
- 2278 W 5650 S
- 2266 W 5650 S
- 2327 W 5600 S
- 2268 W 5600 S
- 2248 W 5600 S
- 2204 W 5600 S
- 5646 S 2300 W
- 5631 S 2200 W
- 5619 S 2200 W
- 2324 Chateau Dr
- 2324 Chateau Dr Unit G-201