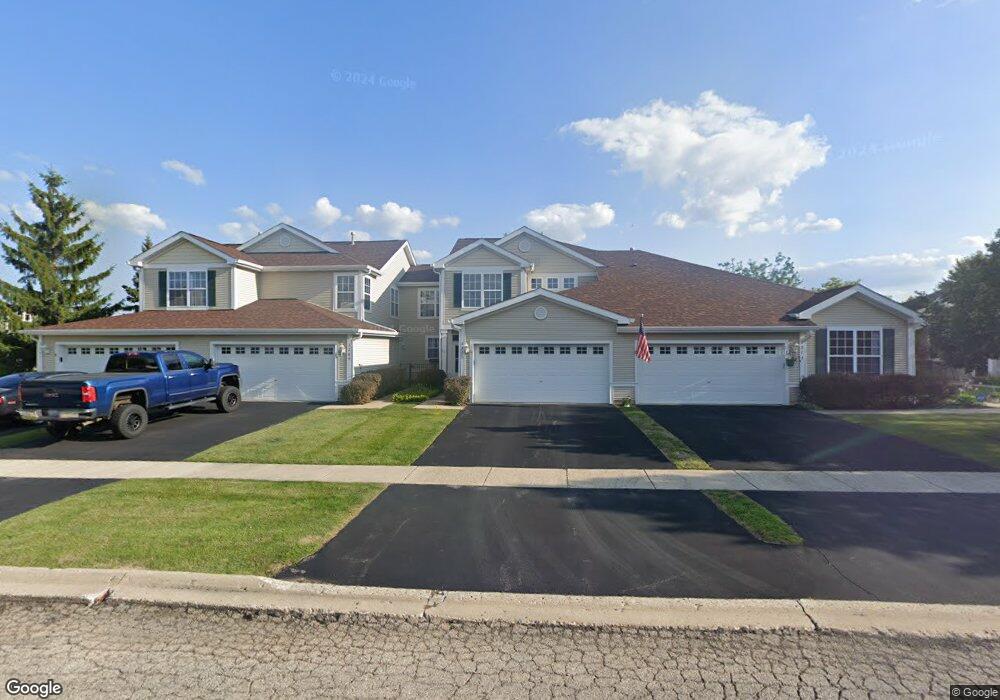
2269 W Bentley Ln Unit 2269 Round Lake, IL 60073
Valley Lakes NeighborhoodEstimated Value: $240,000 - $307,000
2
Beds
3
Baths
1,596
Sq Ft
$165/Sq Ft
Est. Value
About This Home
This home is located at 2269 W Bentley Ln Unit 2269, Round Lake, IL 60073 and is currently estimated at $263,568, approximately $165 per square foot. 2269 W Bentley Ln Unit 2269 is a home located in Lake County with nearby schools including Big Hollow Primary School, Big Hollow Elementary School, and Big Hollow Middle School.
Ownership History
Date
Name
Owned For
Owner Type
Purchase Details
Closed on
May 16, 2017
Sold by
Maves Priscilla A
Bought by
Scoleri Thomas
Current Estimated Value
Home Financials for this Owner
Home Financials are based on the most recent Mortgage that was taken out on this home.
Original Mortgage
$84,095
Outstanding Balance
$69,801
Interest Rate
4.03%
Mortgage Type
New Conventional
Estimated Equity
$193,767
Purchase Details
Closed on
Mar 19, 2010
Sold by
Maves Priscilla A
Bought by
Maves Priscilla A and The Priscilla A Maves Living Trust
Purchase Details
Closed on
Jul 19, 2002
Sold by
Remington At Valley Lakes Llc
Bought by
Maves Priscilla A
Home Financials for this Owner
Home Financials are based on the most recent Mortgage that was taken out on this home.
Original Mortgage
$110,000
Interest Rate
6.63%
Create a Home Valuation Report for This Property
The Home Valuation Report is an in-depth analysis detailing your home's value as well as a comparison with similar homes in the area
Home Values in the Area
Average Home Value in this Area
Purchase History
| Date | Buyer | Sale Price | Title Company |
|---|---|---|---|
| Scoleri Thomas | $152,900 | Baird & Warner Title Service | |
| Maves Priscilla A | -- | None Available | |
| Maves Priscilla A | $162,500 | -- |
Source: Public Records
Mortgage History
| Date | Status | Borrower | Loan Amount |
|---|---|---|---|
| Open | Scoleri Thomas | $84,095 | |
| Previous Owner | Maves Priscilla A | $110,000 |
Source: Public Records
Tax History Compared to Growth
Tax History
| Year | Tax Paid | Tax Assessment Tax Assessment Total Assessment is a certain percentage of the fair market value that is determined by local assessors to be the total taxable value of land and additions on the property. | Land | Improvement |
|---|---|---|---|---|
| 2024 | $4,586 | $66,228 | $6,744 | $59,484 |
| 2023 | $4,995 | $57,739 | $6,353 | $51,386 |
| 2022 | $4,995 | $54,146 | $4,560 | $49,586 |
| 2021 | $4,863 | $51,038 | $4,298 | $46,740 |
| 2020 | $4,291 | $50,309 | $4,237 | $46,072 |
| 2019 | $4,125 | $48,244 | $4,063 | $44,181 |
| 2018 | $3,363 | $40,729 | $7,284 | $33,445 |
| 2017 | $2,184 | $37,646 | $6,733 | $30,913 |
| 2016 | $2,412 | $34,430 | $6,158 | $28,272 |
| 2015 | $2,520 | $32,130 | $5,747 | $26,383 |
| 2014 | $2,537 | $29,610 | $5,488 | $24,122 |
| 2012 | $3,308 | $36,890 | $5,718 | $31,172 |
Source: Public Records
Map
Nearby Homes
- 34113 N Primrose Ct
- 25619 W Bluestem Rd
- 34156 N Redtop Rd
- 389 Prairie Mist Dr
- 34325 N Barberry Rd Unit 633
- 34346 N White Clover Ct Unit 34346
- 34382 N Goldenrod Ct Unit 26139
- 25644 W Brooks Farm Rd
- 26 N Berkshire Ln
- 33336 N Fish Lake Rd
- 33703 N Christa Dr
- 34550 N Wilson Rd
- 26183 W Wooster Lake Ave
- 308 S Fieldstone Ct
- 330 S Fieldstone Ct
- 338 S Litchfield Dr
- 1688 W Turtle Creek Ln
- 1561 W Turtle Creek Ln
- 1506 W Turtle Creek Ln
- 649 N Fox Trail
- 2269 W Bentley Ln
- 2273 W Bentley Ln
- 2265 W Bentley Ln
- 2261 W Bentley Ln
- 2283 W Bentley Ln
- 382 N Keswick Cir
- 386 N Keswick Cir
- 388 N Keswick Cir
- 2287 W Bentley Ln
- 2287 W Bentley Ln Unit 2587
- 390 N Keswick Cir
- 2291 W Bentley Ln
- 434 N Keswick Ct
- 2293 W Bentley Ln
- 438 N Keswick Ct
- 380 N Keswick Cir
- 407 N Keswick Ct
- 376 N Keswick Cir
- 376 N Keswick Cir Unit 376
- 401 N Keswick Ct