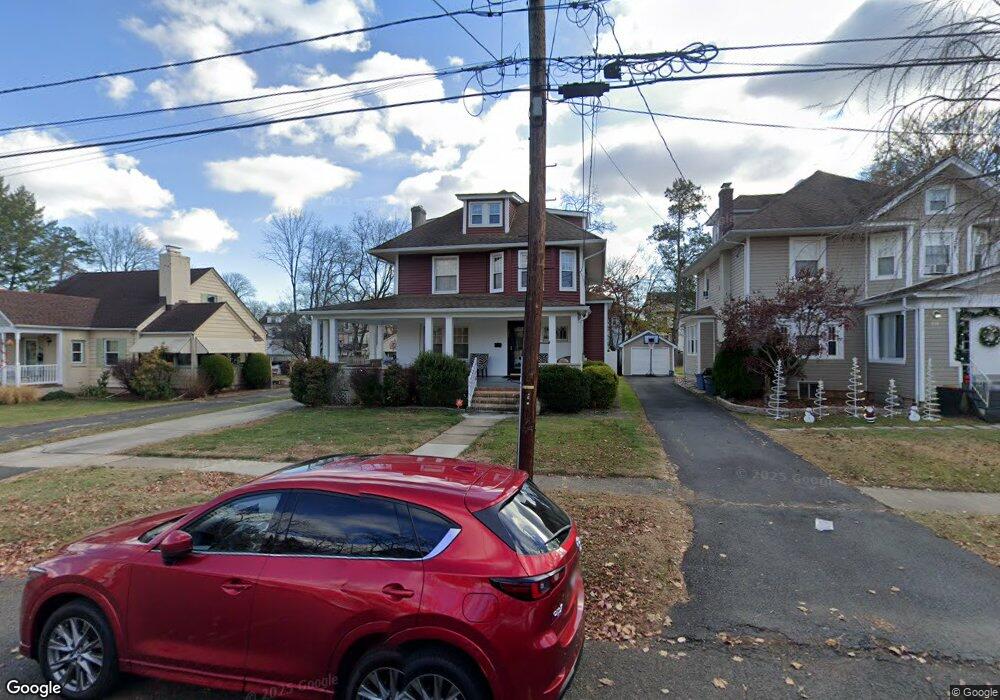
227 3rd St Dunellen, NJ 08812
Estimated Value: $459,000 - $548,000
Studio
--
Bath
1,937
Sq Ft
$260/Sq Ft
Est. Value
About This Home
This home is located at 227 3rd St, Dunellen, NJ 08812 and is currently estimated at $504,512, approximately $260 per square foot. 227 3rd St is a home located in Middlesex County with nearby schools including John P. Faber Elementary School, Lincoln Middle School, and Dunellen High School.
Ownership History
Date
Name
Owned For
Owner Type
Purchase Details
Closed on
Feb 23, 1999
Sold by
Jones Steven
Bought by
Palka Stanley and Palka Theresa
Current Estimated Value
Home Financials for this Owner
Home Financials are based on the most recent Mortgage that was taken out on this home.
Original Mortgage
$158,000
Outstanding Balance
$37,462
Interest Rate
6.76%
Estimated Equity
$467,050
Purchase Details
Closed on
Aug 26, 1993
Sold by
Dachowski Theodore
Bought by
Jones Steven and Jones Aida
Home Financials for this Owner
Home Financials are based on the most recent Mortgage that was taken out on this home.
Original Mortgage
$150,000
Interest Rate
7.21%
Create a Home Valuation Report for This Property
The Home Valuation Report is an in-depth analysis detailing your home's value as well as a comparison with similar homes in the area
Home Values in the Area
Average Home Value in this Area
Purchase History
| Date | Buyer | Sale Price | Title Company |
|---|---|---|---|
| Palka Stanley | $168,000 | -- | |
| Jones Steven | $158,000 | -- |
Source: Public Records
Mortgage History
| Date | Status | Borrower | Loan Amount |
|---|---|---|---|
| Open | Palka Stanley | $158,000 | |
| Previous Owner | Jones Steven | $150,000 |
Source: Public Records
Tax History
| Year | Tax Paid | Tax Assessment Tax Assessment Total Assessment is a certain percentage of the fair market value that is determined by local assessors to be the total taxable value of land and additions on the property. | Land | Improvement |
|---|---|---|---|---|
| 2025 | $11,785 | $469,900 | $96,100 | $373,800 |
| 2024 | $10,605 | $469,900 | $96,100 | $373,800 |
| 2023 | $10,605 | $391,600 | $96,100 | $295,500 |
| 2022 | $10,812 | $391,600 | $96,100 | $295,500 |
| 2021 | $9,092 | $326,800 | $96,100 | $230,700 |
| 2020 | $9,517 | $293,000 | $106,700 | $186,300 |
| 2019 | $9,092 | $293,000 | $106,700 | $186,300 |
| 2018 | $8,090 | $59,900 | $23,800 | $36,100 |
| 2017 | $7,763 | $59,900 | $23,800 | $36,100 |
| 2016 | $7,480 | $59,900 | $23,800 | $36,100 |
| 2015 | $7,293 | $59,900 | $23,800 | $36,100 |
| 2014 | $7,139 | $59,900 | $23,800 | $36,100 |
Source: Public Records
Map
Nearby Homes
- 210 2nd St
- 314 3rd St
- 220 1st St
- 417 2nd St
- 419 Dunellen Ave
- 500 2nd St
- 12 Jefferson Ave
- 405 Madison Ave
- 112 Greenbrook Rd
- 2 Gold St
- 529 Dunellen Ave
- 539 Mountainview Terrace
- 1 Andrew St
- 8 Andrew St
- 310 Sanford Ave
- 713 1st St
- 203 S Washington Ave
- 13 Park Ave Unit 15
- 241 Orange St
- 219 Gertrude Terrace
Your Personal Tour Guide
Ask me questions while you tour the home.