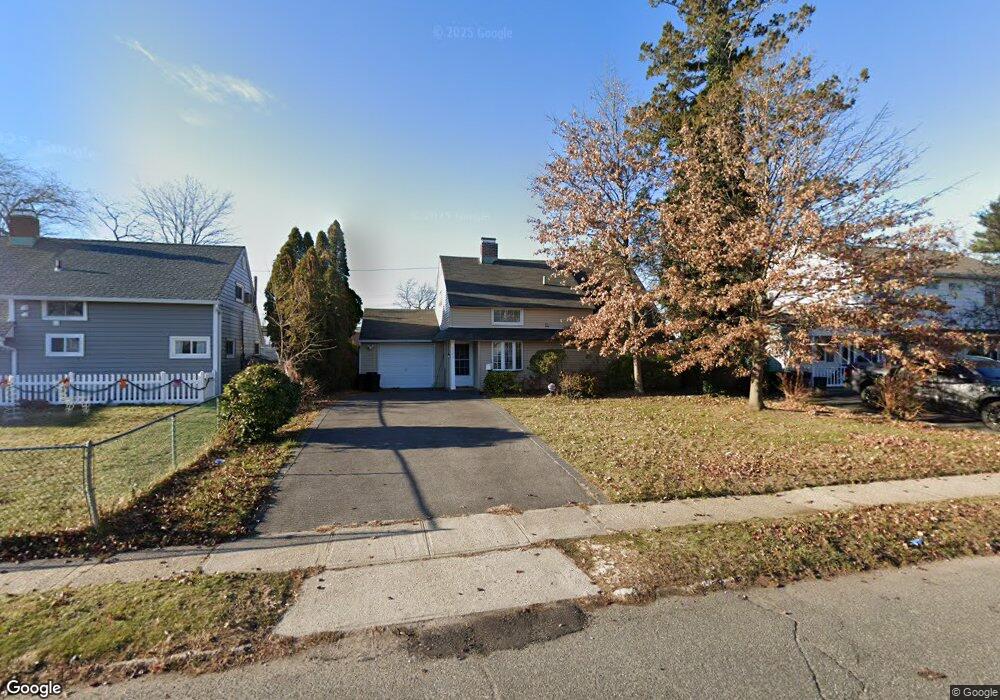
227 Cypress Ln W Westbury, NY 11590
Estimated Value: $656,000 - $813,365
4
Beds
2
Baths
1,418
Sq Ft
$518/Sq Ft
Est. Value
About This Home
This home is located at 227 Cypress Ln W, Westbury, NY 11590 and is currently estimated at $734,683, approximately $518 per square foot. 227 Cypress Ln W is a home located in Nassau County with nearby schools including Bowling Green Elementary School, Carousel Day School, and Long Island Christian Academy.
Ownership History
Date
Name
Owned For
Owner Type
Purchase Details
Closed on
Apr 10, 2019
Sold by
Buchberg Kyle and Buchberg Elizabeth
Bought by
Balansag Venjie Y and Balasag Mae Charresh L
Current Estimated Value
Home Financials for this Owner
Home Financials are based on the most recent Mortgage that was taken out on this home.
Original Mortgage
$368,000
Outstanding Balance
$323,537
Interest Rate
4.3%
Mortgage Type
New Conventional
Estimated Equity
$411,146
Purchase Details
Closed on
Mar 20, 2014
Sold by
Sancho Mary C
Bought by
Buchberg Kyle and Vuolo Elizabeth
Home Financials for this Owner
Home Financials are based on the most recent Mortgage that was taken out on this home.
Original Mortgage
$336,300
Interest Rate
4.33%
Mortgage Type
Purchase Money Mortgage
Purchase Details
Closed on
Aug 15, 2006
Sold by
Sancho Mary
Purchase Details
Closed on
Aug 14, 2006
Sold by
Calvo Richard
Create a Home Valuation Report for This Property
The Home Valuation Report is an in-depth analysis detailing your home's value as well as a comparison with similar homes in the area
Home Values in the Area
Average Home Value in this Area
Purchase History
| Date | Buyer | Sale Price | Title Company |
|---|---|---|---|
| Balansag Venjie Y | $460,000 | None Available | |
| Buchberg Kyle | $354,000 | The Judicial Title Insurance | |
| -- | -- | -- | |
| -- | -- | -- |
Source: Public Records
Mortgage History
| Date | Status | Borrower | Loan Amount |
|---|---|---|---|
| Open | Balansag Venjie Y | $368,000 | |
| Previous Owner | Buchberg Kyle | $336,300 |
Source: Public Records
Tax History Compared to Growth
Tax History
| Year | Tax Paid | Tax Assessment Tax Assessment Total Assessment is a certain percentage of the fair market value that is determined by local assessors to be the total taxable value of land and additions on the property. | Land | Improvement |
|---|---|---|---|---|
| 2025 | $10,773 | $443 | $239 | $204 |
| 2024 | $3,350 | $443 | $239 | $204 |
| 2023 | $10,735 | $469 | $254 | $215 |
| 2022 | $10,735 | $443 | $239 | $204 |
| 2021 | $13,338 | $458 | $247 | $211 |
| 2020 | $10,471 | $586 | $585 | $1 |
| 2019 | $3,036 | $586 | $558 | $28 |
| 2018 | $3,141 | $625 | $0 | $0 |
| 2017 | $7,728 | $785 | $595 | $190 |
| 2016 | $11,491 | $785 | $595 | $190 |
| 2015 | $3,267 | $785 | $595 | $190 |
| 2014 | $3,267 | $785 | $595 | $190 |
| 2013 | $2,982 | $785 | $595 | $190 |
Source: Public Records
Map
Nearby Homes
- 223 Cypress Ln W
- 229 Cypress Ln W
- 233 Cypress Ln W
- 221 Cypress Ln W
- 226 Cypress Ln W
- 228 Cypress Ln W
- 222 Cypress Ln W
- 235 Cypress Ln W
- 217 Cypress Ln W
- 232 Cypress Ln W
- 220 Cypress Ln W
- 234 Cypress Ln W
- 215 Cypress Ln W
- 239 Cypress Ln W
- 216 Cypress Ln W
- 16 Cottonwood Ln
- 12 Cottonwood Ln
- 18 Cottonwood Ln
- 238 Cypress Ln W
- 8 Cottonwood Ln