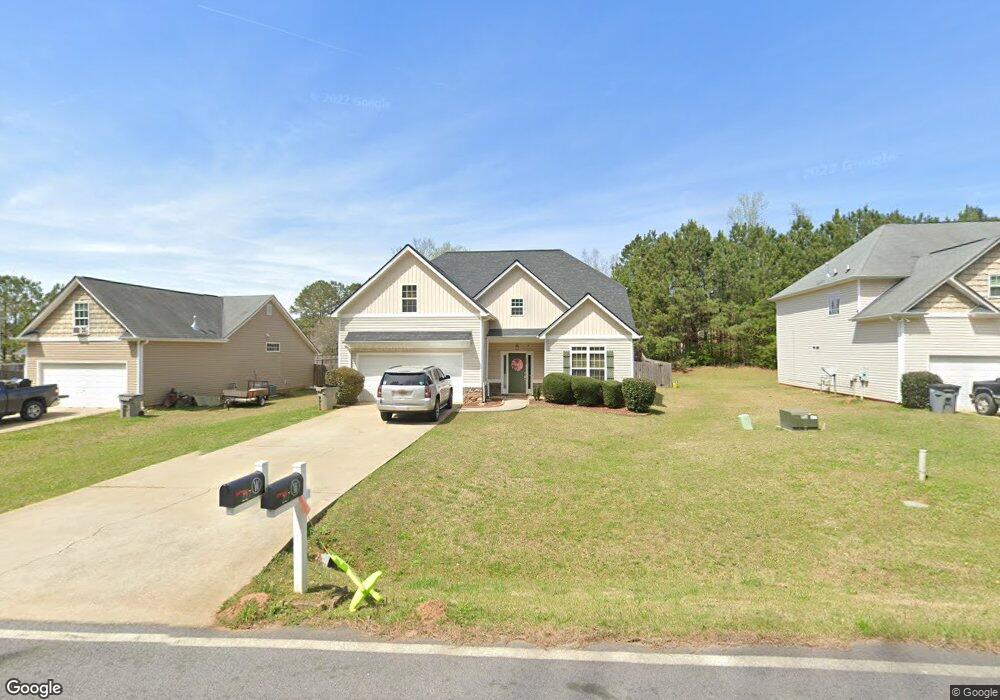
227 Hood Rd Lagrange, GA 30241
Estimated Value: $316,000 - $368,000
4
Beds
3
Baths
2,495
Sq Ft
$135/Sq Ft
Est. Value
About This Home
This home is located at 227 Hood Rd, Lagrange, GA 30241 and is currently estimated at $336,937, approximately $135 per square foot. 227 Hood Rd is a home located in Troup County with nearby schools including Whitesville Road Elementary School, Berta Weathersbee Elementary School, and Rosemont Elementary School.
Ownership History
Date
Name
Owned For
Owner Type
Purchase Details
Closed on
Jun 30, 2009
Sold by
Jeff Lindsey Communities I
Bought by
Lyons Teresa L
Current Estimated Value
Home Financials for this Owner
Home Financials are based on the most recent Mortgage that was taken out on this home.
Original Mortgage
$169,866
Outstanding Balance
$110,640
Interest Rate
5.27%
Mortgage Type
FHA
Estimated Equity
$226,297
Purchase Details
Closed on
Oct 24, 2008
Sold by
David Lindsey Homes Inc
Bought by
Jeff Lindsey Communities Inc
Home Financials for this Owner
Home Financials are based on the most recent Mortgage that was taken out on this home.
Original Mortgage
$131,250
Interest Rate
6.11%
Mortgage Type
New Conventional
Purchase Details
Closed on
Mar 15, 2006
Sold by
Neely Homes Inc
Bought by
David Lindsey Homes Inc
Purchase Details
Closed on
Mar 25, 2004
Bought by
Neely Homes Inc
Create a Home Valuation Report for This Property
The Home Valuation Report is an in-depth analysis detailing your home's value as well as a comparison with similar homes in the area
Home Values in the Area
Average Home Value in this Area
Purchase History
| Date | Buyer | Sale Price | Title Company |
|---|---|---|---|
| Lyons Teresa L | $173,000 | -- | |
| Lyons Teresa L | $173,000 | -- | |
| Jeff Lindsey Communities Inc | $106,000 | -- | |
| David Lindsey Homes Inc | $927,500 | -- | |
| Neely Homes Inc | -- | -- |
Source: Public Records
Mortgage History
| Date | Status | Borrower | Loan Amount |
|---|---|---|---|
| Open | Lyons Teresa L | $169,866 | |
| Closed | Lyons Teresa L | $169,866 | |
| Previous Owner | Jeff Lindsey Communities Inc | $131,250 |
Source: Public Records
Tax History Compared to Growth
Tax History
| Year | Tax Paid | Tax Assessment Tax Assessment Total Assessment is a certain percentage of the fair market value that is determined by local assessors to be the total taxable value of land and additions on the property. | Land | Improvement |
|---|---|---|---|---|
| 2024 | $3,188 | $116,880 | $18,000 | $98,880 |
| 2023 | $2,709 | $99,320 | $14,000 | $85,320 |
| 2022 | $2,601 | $93,200 | $14,000 | $79,200 |
| 2021 | $2,550 | $84,560 | $10,000 | $74,560 |
| 2020 | $2,346 | $77,800 | $10,000 | $67,800 |
| 2019 | $2,394 | $79,360 | $10,000 | $69,360 |
| 2018 | $2,393 | $79,360 | $10,000 | $69,360 |
| 2017 | $2,269 | $75,240 | $10,600 | $64,640 |
| 2016 | $2,212 | $73,336 | $10,600 | $62,736 |
| 2015 | $2,215 | $73,336 | $10,600 | $62,736 |
| 2014 | $2,119 | $70,034 | $10,600 | $59,434 |
| 2013 | -- | $70,786 | $10,600 | $60,186 |
Source: Public Records
Map
Nearby Homes
- 403 Lexington Park Dr
- 109 Lexington Park Dr
- 1708 Upper Big Springs Rd Unit 18.93+/- AC
- 111 Revere Ct
- 401 Nashua Dr
- 105 Beaver Creek Way Unit 248
- 105 Beaver Creek Way
- 107 Beaver Creek Way
- 107 Beaver Creek Way Unit 249
- 103 Beaver Creek Way
- 103 Beaver Creek Way Unit 247
- 810 Callaway Church Rd
- 106 Beaver Creek Way
- 106 Beaver Creek Way Unit 263
- 108 Beaver Creek Way
- 108 Beaver Creek Way Unit 262
- 440 Lakeview Way
- 440 Lakeview Way Unit 267
- 431 Lakeview Way
- 435 Lakeview Way
- 229 Hood Rd
- 224 Hood Rd Unit 34
- 225 Hood Rd Unit 34
- 225 Hood Rd
- 105 Belmont Ct
- 231 Hood Rd
- 223 Hood Rd
- 106 Belmont Ct
- 103 Belmont Ct
- 233 Hood Rd
- 221 Hood Rd
- 406 Baldwin Park Dr
- 405 Lexington Park Dr
- 104 Belmont Ct
- 404 Baldwin Park Dr
- 404 Baldwin Park Dr Unit 67
- 219 Hood Rd
- 407 Lexington Park Dr Unit 55
- 407 Lexington Park Dr
- 101 Belmont Ct