Estimated Value: $55,000 - $61,000
3
Beds
1
Bath
772
Sq Ft
$74/Sq Ft
Est. Value
About This Home
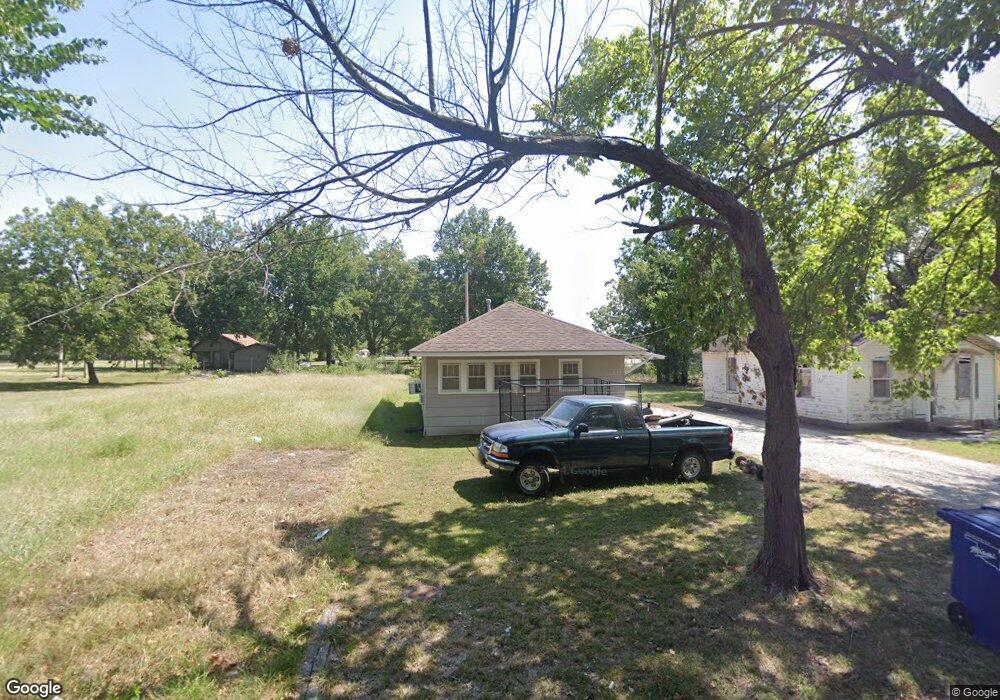
This home is located at 227 K St SE, Miami, OK 74354 and is currently estimated at $57,015, approximately $73 per square foot. 227 K St SE is a home located in Ottawa County with nearby schools including Miami High School and Mt. Olive Lutheran School.
Ownership History
Date
Name
Owned For
Owner Type
Purchase Details
Closed on
Jan 10, 2008
Sold by
Urie Michael David and Urie Jeni
Bought by
Pritchard Daniel L and Pritchard Holly C
Current Estimated Value
Purchase Details
Closed on
Oct 17, 2006
Sold by
Secretary Of Hud Of Washington D C
Bought by
Urie Michael David
Purchase Details
Closed on
Sep 12, 2002
Bought by
Crane Roscoe D
Purchase Details
Closed on
May 21, 2002
Bought by
Burleson Ralph and Burleson Bonnie
Purchase Details
Closed on
Jan 4, 2001
Bought by
Watkins Glen and Watkins Wendy
Purchase Details
Closed on
Jul 8, 1999
Bought by
Yeung Bung
Purchase Details
Closed on
Aug 5, 1998
Bought by
Horner John
Purchase Details
Closed on
Aug 12, 1993
Bought by
Yeung Wai Bunn and Yeung Bung
Create a Home Valuation Report for This Property
The Home Valuation Report is an in-depth analysis detailing your home's value as well as a comparison with similar homes in the area
Home Values in the Area
Average Home Value in this Area
Purchase History
| Date | Buyer | Sale Price | Title Company |
|---|---|---|---|
| Pritchard Daniel L | $7,500 | None Available | |
| Urie Michael David | -- | None Available | |
| Crane Roscoe D | $24,500 | -- | |
| Burleson Ralph | -- | -- | |
| Watkins Glen | $15,000 | -- | |
| Yeung Bung | -- | -- | |
| Horner John | $14,000 | -- | |
| Yeung Wai Bunn | $8,900 | -- |
Source: Public Records
Tax History Compared to Growth
Tax History
| Year | Tax Paid | Tax Assessment Tax Assessment Total Assessment is a certain percentage of the fair market value that is determined by local assessors to be the total taxable value of land and additions on the property. | Land | Improvement |
|---|---|---|---|---|
| 2025 | $302 | $2,815 | $171 | $2,644 |
| 2024 | $302 | $3,131 | $171 | $2,960 |
| 2023 | $302 | $2,982 | $171 | $2,811 |
| 2022 | $263 | $2,840 | $171 | $2,669 |
| 2021 | $256 | $2,705 | $171 | $2,534 |
| 2020 | $245 | $2,576 | $197 | $2,379 |
| 2019 | $201 | $2,453 | $171 | $2,282 |
| 2018 | $203 | $2,453 | $171 | $2,282 |
| 2017 | $206 | $2,453 | $171 | $2,282 |
| 2016 | $207 | $2,580 | $171 | $2,409 |
| 2015 | $248 | $2,793 | $231 | $2,562 |
| 2014 | $229 | $2,793 | $231 | $2,562 |
Source: Public Records
Map
Nearby Homes