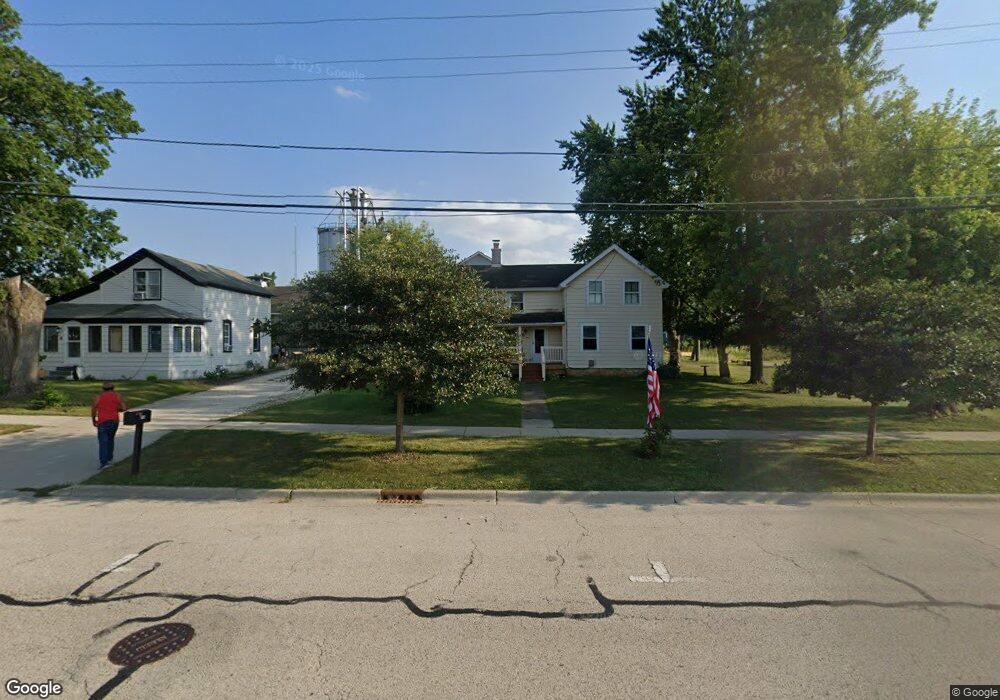
227 Keyes Ave Hampshire, IL 60140
Estimated Value: $236,000 - $372,000
4
Beds
1
Bath
1,636
Sq Ft
$175/Sq Ft
Est. Value
About This Home
This home is located at 227 Keyes Ave, Hampshire, IL 60140 and is currently estimated at $286,000, approximately $174 per square foot. 227 Keyes Ave is a home located in Kane County with nearby schools including Hampshire Elementary School, Hampshire Middle School, and Hampshire High School.
Ownership History
Date
Name
Owned For
Owner Type
Purchase Details
Closed on
Feb 15, 2024
Sold by
Mary E Peterson 2023 Trust
Bought by
Alan L Conro Trust and Conro
Current Estimated Value
Purchase Details
Closed on
Feb 14, 2024
Sold by
Peterson David T
Bought by
Alan L Conro Trust and Conro
Purchase Details
Closed on
Jul 17, 2023
Sold by
Peterson Mary E
Bought by
Mary E Peterson 2023 Trust and Peterson
Purchase Details
Closed on
Jan 10, 2023
Sold by
Marian C Peterson Revocable Trust
Bought by
Peterson Mary E and Peterson David T
Purchase Details
Closed on
May 16, 2019
Sold by
Conro Robert and Conro Evelyn G
Bought by
Conro Robert G and Robert G Conro Trust No 1
Purchase Details
Closed on
Nov 13, 2000
Sold by
Peterson Marian
Bought by
Peterson Marian C and Marian C Peterson Revocable Trust
Purchase Details
Closed on
Mar 6, 1997
Sold by
Zeller Alice
Bought by
Conro Robert and Peterson Marian
Create a Home Valuation Report for This Property
The Home Valuation Report is an in-depth analysis detailing your home's value as well as a comparison with similar homes in the area
Home Values in the Area
Average Home Value in this Area
Purchase History
| Date | Buyer | Sale Price | Title Company |
|---|---|---|---|
| Alan L Conro Trust | $40,000 | None Listed On Document | |
| Alan L Conro Trust | $40,000 | None Listed On Document | |
| Mary E Peterson 2023 Trust | -- | None Listed On Document | |
| Peterson Mary E | -- | -- | |
| Conro Robert G | -- | Attorney | |
| Peterson Marian C | -- | -- | |
| Conro Robert | $15,000 | -- |
Source: Public Records
Tax History Compared to Growth
Tax History
| Year | Tax Paid | Tax Assessment Tax Assessment Total Assessment is a certain percentage of the fair market value that is determined by local assessors to be the total taxable value of land and additions on the property. | Land | Improvement |
|---|---|---|---|---|
| 2024 | $4,371 | $59,722 | $23,416 | $36,306 |
| 2023 | $4,201 | $53,721 | $21,063 | $32,658 |
| 2022 | $3,959 | $49,372 | $19,358 | $30,014 |
| 2021 | $3,773 | $46,573 | $18,261 | $28,312 |
| 2020 | $3,718 | $45,300 | $17,762 | $27,538 |
| 2019 | $3,674 | $43,819 | $17,181 | $26,638 |
| 2018 | $3,523 | $40,456 | $15,288 | $25,168 |
| 2017 | $3,429 | $38,855 | $14,683 | $24,172 |
| 2016 | $3,384 | $36,524 | $13,802 | $22,722 |
| 2015 | -- | $33,947 | $12,828 | $21,119 |
| 2014 | -- | $32,828 | $12,405 | $20,423 |
| 2013 | -- | $34,927 | $13,198 | $21,729 |
Source: Public Records
Map
Nearby Homes
- 862 Briar Glen Ct
- 820 Briar Glen Ct
- 804 Briar Glen Ct
- 125 Mill Ave
- Lot 0 N State St
- 190 Grove Ave
- 263 E Jackson Ave
- 421 Klick St
- 704 S State St
- 286 Wild Prairie Pointe
- 284 Wild Prairie Pointe
- 283 Wild Prairie Pointe
- 282 Wild Prairie Pointe
- 895 S State St
- 318 Old Mill Ln
- 1655 Windsor Rd
- 531 W Meadowdale Cir
- 666 Savanna Dr
- 714 Wild Prairie Point
- 602 Woodside Terrace
- 231 Keyes Ave
- 191 Keyes Ave
- 220 Keyes Ave
- 187 Keyes Ave
- 247 Keyes Ave
- 103 N State St
- 251 Keyes Ave
- 138 Washington Ave
- 148 Washington Ave
- 1115 Briar Glen Ct
- 1105 Briar Glen Ct
- 1109 Briar Glen Ct
- 1113 Briar Glen Ct
- 1107 Briar Glen Ct
- 1135 Briar Glen Ct
- 1123 Briar Glen Ct
- 1125 Briar Glen Ct
- 1133 Briar Glen Ct
- 1131 Briar Glen Ct
- 878 Briar Glen Ct