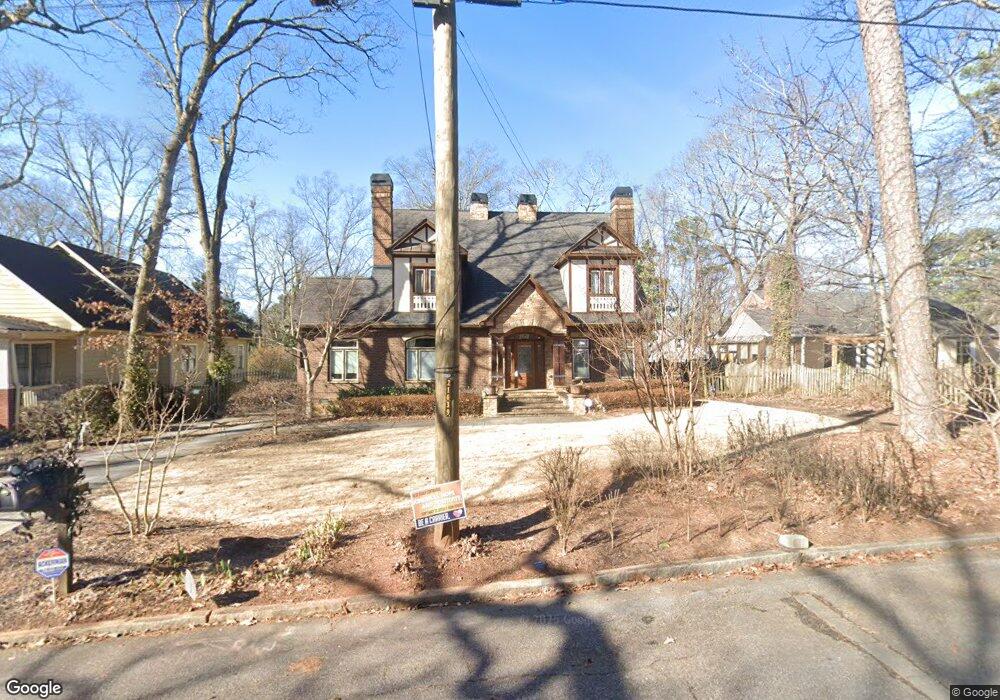
227 Oakridge Ave SE Atlanta, GA 30317
East Lake NeighborhoodEstimated Value: $1,250,144 - $1,751,000
7
Beds
6
Baths
5,636
Sq Ft
$252/Sq Ft
Est. Value
About This Home
This home is located at 227 Oakridge Ave SE, Atlanta, GA 30317 and is currently estimated at $1,421,786, approximately $252 per square foot. 227 Oakridge Ave SE is a home located in DeKalb County with nearby schools including Toomer Elementary School, King Middle School, and Maynard Holbrook Jackson High School.
Ownership History
Date
Name
Owned For
Owner Type
Purchase Details
Closed on
Aug 3, 2011
Sold by
2914 Greenspan Court Trust
Bought by
White Deborah L and Williams Dennis D
Current Estimated Value
Home Financials for this Owner
Home Financials are based on the most recent Mortgage that was taken out on this home.
Original Mortgage
$405,000
Outstanding Balance
$280,070
Interest Rate
4.62%
Mortgage Type
New Conventional
Estimated Equity
$1,141,716
Purchase Details
Closed on
Feb 8, 2010
Sold by
Suntrust Mtg Inc
Bought by
2914 Greenspan Court Llc
Purchase Details
Closed on
Oct 6, 2009
Sold by
Means David J
Bought by
Suntrust Mtg Inc
Purchase Details
Closed on
Mar 15, 2005
Sold by
Peak Dan
Bought by
Means David J
Home Financials for this Owner
Home Financials are based on the most recent Mortgage that was taken out on this home.
Original Mortgage
$237,250
Interest Rate
5.88%
Mortgage Type
New Conventional
Purchase Details
Closed on
Oct 29, 2004
Sold by
Parham-Hughley Tammie
Bought by
Peak Dan
Create a Home Valuation Report for This Property
The Home Valuation Report is an in-depth analysis detailing your home's value as well as a comparison with similar homes in the area
Home Values in the Area
Average Home Value in this Area
Purchase History
| Date | Buyer | Sale Price | Title Company |
|---|---|---|---|
| White Deborah L | $540,000 | -- | |
| 2914 Greenspan Court Llc | $230,000 | -- | |
| Suntrust Mtg Inc | $314,500 | -- | |
| Means David J | $151,000 | -- | |
| Peak Dan | $130,000 | -- |
Source: Public Records
Mortgage History
| Date | Status | Borrower | Loan Amount |
|---|---|---|---|
| Open | White Deborah L | $405,000 | |
| Closed | White Deborah L | $52,000 | |
| Previous Owner | Means David J | $237,250 |
Source: Public Records
Tax History Compared to Growth
Tax History
| Year | Tax Paid | Tax Assessment Tax Assessment Total Assessment is a certain percentage of the fair market value that is determined by local assessors to be the total taxable value of land and additions on the property. | Land | Improvement |
|---|---|---|---|---|
| 2025 | -- | $455,160 | $93,040 | $362,120 |
| 2024 | -- | $452,160 | $83,120 | $369,040 |
| 2023 | $10,722 | $428,760 | $83,120 | $345,640 |
| 2022 | $9,105 | $331,280 | $83,120 | $248,160 |
| 2021 | $204 | $331,280 | $83,120 | $248,160 |
| 2020 | $204 | $371,920 | $83,120 | $288,800 |
| 2019 | $98 | $330,800 | $92,320 | $238,480 |
| 2018 | $906 | $273,280 | $43,360 | $229,920 |
| 2017 | $1,274 | $236,800 | $44,992 | $191,808 |
| 2016 | $1,200 | $236,800 | $44,992 | $191,808 |
| 2014 | $862 | $229,440 | $48,600 | $180,840 |
Source: Public Records
Map
Nearby Homes
- 2830 Alston Dr SE
- 2749 Memorial Dr SE
- 2824 Tupelo St SE
- 2877 Alexa Ave SE
- 1533 N Ellington St SE
- 2762 Arbor Ave SE
- 2676 Colgan Ct SE
- 372 Ashburton Ave SE
- 371 Hooper St SE
- 1524 N Ellington St SE
- 338 Candler Rd SE
- 2808 Hosea L Williams Dr NE
- 401 Ashburton Ave SE
- 2502 E Tupelo St SE
- 2504 Rose Cir
- 427 Hooper St SE
- 25 Daniel Ave NE
- 217 Oakridge Ave SE
- 231 Oakridge Ave SE
- 2821 Memorial Dr SE
- 2815 Memorial Dr SE
- 233 Oakridge Ave SE
- 2851 Memorial Dr SE
- 232 Oakridge Ave SE
- 247 Oakridge Ave SE
- 2820 Memorial Dr SE
- 2820 Memorial Dr SE
- 2812 Memorial Dr SE
- 2801 Memorial Dr SE
- 240 Oakridge Ave SE
- 2830 Memorial Dr SE
- 2806 Memorial Dr SE
- 2840 Memorial Dr SE
- 2795 Memorial Dr SE
- 248 Oakridge Ave SE
- 228 Oakridge Ave SE
- 2850 Memorial Dr SE