227 Rice St Elmore, OH 43416
Estimated Value: $165,792 - $183,000
About This Home
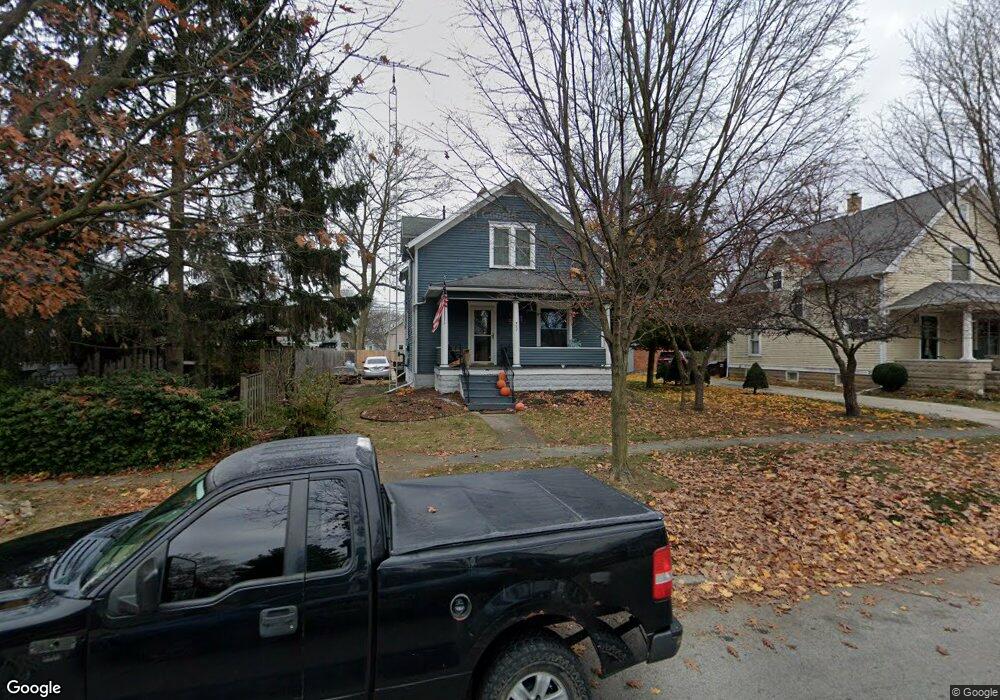
This home is located at 227 Rice St, Elmore, OH 43416 and is currently estimated at $173,198, approximately $130 per square foot. 227 Rice St is a home located in Ottawa County with nearby schools including Woodmore Elementary School, Woodmore Middle School, and Woodmore High School.
Ownership History
We collect this data history from publicly available records. To have your information removed, we recommend requesting removal directly through your county’s website.
Purchase Details
Purchase Details
Home Financials for this Owner
Home Financials are based on the most recent Mortgage that was taken out on this home.Home Values in the Area
Average Home Value in this Area
Purchase History
We collect this data history from publicly available records. To have your information removed, we recommend requesting removal directly through your county’s website.
| Date | Buyer | Sale Price | Title Company |
|---|---|---|---|
| -- | Attorney | ||
| $83,000 | -- |
Mortgage History
We collect this data history from publicly available records. To have your information removed, we recommend requesting removal directly through your county’s website.
| Date | Status | Borrower | Loan Amount |
|---|---|---|---|
| Open | $78,850 |
Tax History
We collect this data history from publicly available records. To have your information removed, we recommend requesting removal directly through your county’s website.
| Year | Tax Paid | Tax Assessment Tax Assessment Total Assessment is a certain percentage of the fair market value that is determined by local assessors to be the total taxable value of land and additions on the property. | Land | Improvement |
|---|---|---|---|---|
| 2025 | $2,029 | $38,133 | $9,072 | $29,061 |
| 2024 | $2,029 | $38,133 | $9,072 | $29,061 |
| 2023 | $2,025 | $32,120 | $6,720 | $25,400 |
| 2022 | $1,837 | $32,120 | $6,720 | $25,400 |
| 2021 | $1,850 | $32,120 | $6,720 | $25,400 |
| 2020 | $1,718 | $28,270 | $6,720 | $21,550 |
| 2019 | $1,695 | $28,270 | $6,720 | $21,550 |
| 2018 | $1,676 | $28,270 | $6,720 | $21,550 |
| 2017 | $1,494 | $25,040 | $6,720 | $18,320 |
| 2016 | $1,461 | $25,040 | $6,720 | $18,320 |
| 2015 | $1,553 | $25,040 | $6,720 | $18,320 |
| 2014 | $788 | $24,050 | $6,720 | $17,330 |
| 2013 | $1,580 | $24,050 | $6,720 | $17,330 |
Map
- 340 Fremont St
- 19270 W State Route 105
- 348 E 4th St
- 444 Clinton St
- 334 Lincoln St
- 586 Ames St
- 19035 W Orchard Dr
- 17479 W Portage River South Rd
- 849 Water St
- 1001 Oak St
- 620 Water St
- 211 Lime St
- 812 W College Ave
- 913 W College Ave
- 2574 County Road 74
- 401 Main St
- 0 Woodpointe Dr
- 103 W 6th St
- 673 Nottingham Dr
- 915 Washington St
Ask me questions while you tour the home.