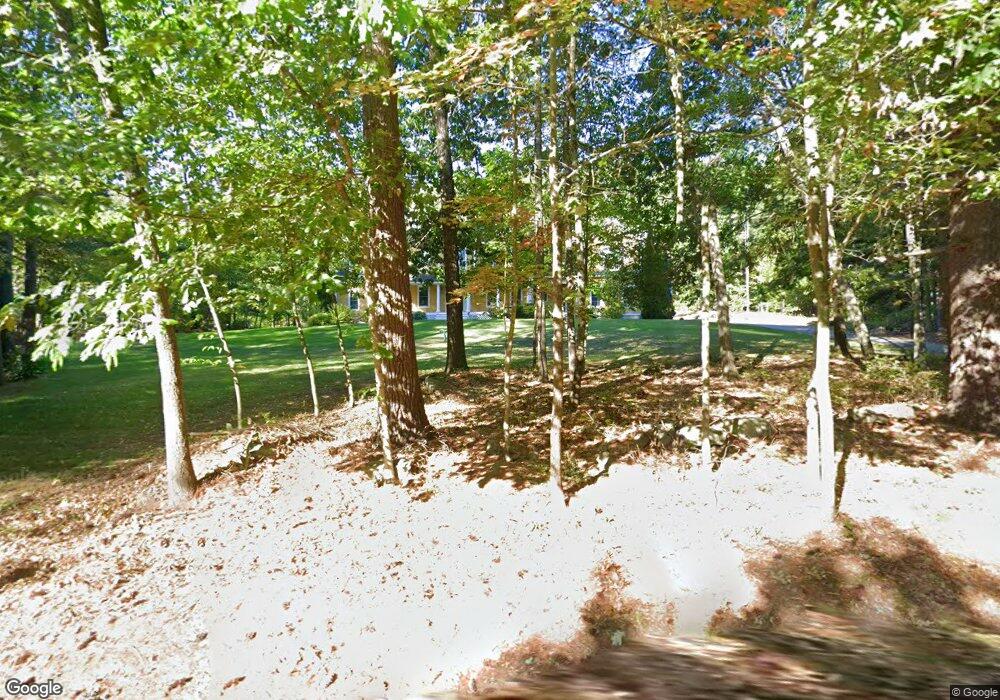
227 River St Dunstable, MA 01827
Estimated Value: $1,064,000 - $1,290,000
4
Beds
3
Baths
3,250
Sq Ft
$355/Sq Ft
Est. Value
About This Home
This home is located at 227 River St, Dunstable, MA 01827 and is currently estimated at $1,153,179, approximately $354 per square foot. 227 River St is a home located in Middlesex County with nearby schools including Groton Dunstable Regional High School.
Ownership History
Date
Name
Owned For
Owner Type
Purchase Details
Closed on
Dec 20, 1999
Sold by
Tully Kenneth A
Bought by
Degroot Pieter and Degroot Georgana
Current Estimated Value
Home Financials for this Owner
Home Financials are based on the most recent Mortgage that was taken out on this home.
Original Mortgage
$275,000
Interest Rate
7.81%
Mortgage Type
Purchase Money Mortgage
Create a Home Valuation Report for This Property
The Home Valuation Report is an in-depth analysis detailing your home's value as well as a comparison with similar homes in the area
Home Values in the Area
Average Home Value in this Area
Purchase History
| Date | Buyer | Sale Price | Title Company |
|---|---|---|---|
| Degroot Pieter | $348,800 | -- |
Source: Public Records
Mortgage History
| Date | Status | Borrower | Loan Amount |
|---|---|---|---|
| Open | Degroot Pieter | $411,000 | |
| Closed | Degroot Pieter | $265,500 | |
| Closed | Degroot Pieter | $275,000 |
Source: Public Records
Tax History
| Year | Tax Paid | Tax Assessment Tax Assessment Total Assessment is a certain percentage of the fair market value that is determined by local assessors to be the total taxable value of land and additions on the property. | Land | Improvement |
|---|---|---|---|---|
| 2025 | $15,033 | $1,093,300 | $214,400 | $878,900 |
| 2024 | $14,602 | $1,046,000 | $209,200 | $836,800 |
| 2023 | $14,283 | $954,100 | $209,200 | $744,900 |
| 2022 | $12,543 | $822,500 | $209,200 | $613,300 |
| 2021 | $12,278 | $748,200 | $185,400 | $562,800 |
| 2020 | $12,056 | $715,900 | $177,200 | $538,700 |
| 2019 | $11,647 | $682,700 | $177,200 | $505,500 |
| 2018 | $11,366 | $648,000 | $176,200 | $471,800 |
| 2017 | $10,913 | $641,200 | $176,200 | $465,000 |
| 2016 | $10,216 | $617,300 | $151,700 | $465,600 |
| 2015 | $10,578 | $632,300 | $148,500 | $483,800 |
| 2014 | $9,971 | $632,300 | $148,500 | $483,800 |
Source: Public Records
Map
Nearby Homes
- 24 Unkety Brook Way
- 147 Nashua Rd
- 8 Casie Ln
- 77 Birchwood Dr
- 6 Testament Cir Unit 5
- 38 Tarbell St Unit 5B
- 38 Tarbell St Unit 1D
- 29 Tarbell St
- 28-30 Groton St
- 1 Pats Way
- 208 North St
- 21 Shawn Ave
- 39 Hollis St Unit A
- 4 Southgate Rd
- 14 Brookline St
- 179 Wyman Rd
- 10 Bennett St
- 235 Kemp St
- 114 Groton St
- 1 Ladd Ln
Your Personal Tour Guide
Ask me questions while you tour the home.