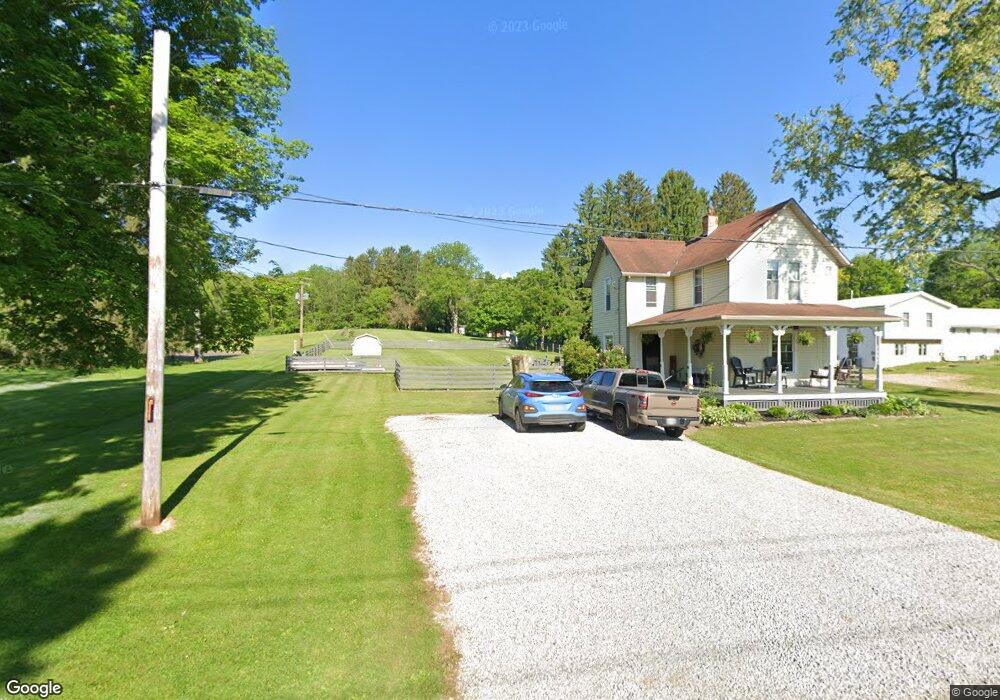
227 Sychar Rd Mount Vernon, OH 43050
Estimated Value: $186,303 - $220,000
3
Beds
1
Bath
1,332
Sq Ft
$155/Sq Ft
Est. Value
About This Home
This home is located at 227 Sychar Rd, Mount Vernon, OH 43050 and is currently estimated at $206,076, approximately $154 per square foot. 227 Sychar Rd is a home located in Knox County with nearby schools including Mount Vernon High School, St. Vincent de Paul School, and Mount Vernon Sda Elementary School.
Ownership History
Date
Name
Owned For
Owner Type
Purchase Details
Closed on
Aug 21, 2007
Sold by
Richards Michael D and Richards Melanie D
Bought by
Erb Jacob C and Erb Samantha L
Current Estimated Value
Home Financials for this Owner
Home Financials are based on the most recent Mortgage that was taken out on this home.
Original Mortgage
$118,000
Outstanding Balance
$75,131
Interest Rate
6.77%
Mortgage Type
New Conventional
Estimated Equity
$130,945
Purchase Details
Closed on
Aug 1, 2002
Sold by
Sapp Laura L
Bought by
Richards Michael D and Richards Mela
Purchase Details
Closed on
Jul 14, 1993
Sold by
Sapp Richard S and Sapp Laura
Bought by
Sapp Laura L
Purchase Details
Closed on
Aug 4, 1989
Sold by
Shobe Donald E and Shobe Deborah
Bought by
Sapp Richard S and Sapp Laura
Purchase Details
Closed on
Feb 7, 1986
Bought by
Shobe Donald E and Shobe Deborah
Create a Home Valuation Report for This Property
The Home Valuation Report is an in-depth analysis detailing your home's value as well as a comparison with similar homes in the area
Home Values in the Area
Average Home Value in this Area
Purchase History
| Date | Buyer | Sale Price | Title Company |
|---|---|---|---|
| Erb Jacob C | $88,500 | None Available | |
| Ross Tanja P | $4,875 | None Available | |
| Richards Michael D | $89,000 | -- | |
| Sapp Laura L | -- | -- | |
| Sapp Richard S | $32,000 | -- | |
| Shobe Donald E | $20,000 | -- |
Source: Public Records
Mortgage History
| Date | Status | Borrower | Loan Amount |
|---|---|---|---|
| Open | Erb Jacob C | $118,000 |
Source: Public Records
Tax History
| Year | Tax Paid | Tax Assessment Tax Assessment Total Assessment is a certain percentage of the fair market value that is determined by local assessors to be the total taxable value of land and additions on the property. | Land | Improvement |
|---|---|---|---|---|
| 2024 | $1,420 | $35,380 | $9,190 | $26,190 |
| 2023 | $1,450 | $35,380 | $9,190 | $26,190 |
| 2022 | $1,198 | $26,210 | $6,810 | $19,400 |
| 2021 | $1,198 | $26,210 | $6,810 | $19,400 |
| 2020 | $1,169 | $26,210 | $6,810 | $19,400 |
| 2019 | $1,231 | $25,590 | $5,970 | $19,620 |
| 2018 | $1,231 | $25,590 | $5,970 | $19,620 |
| 2017 | $1,211 | $25,590 | $5,970 | $19,620 |
| 2016 | $1,127 | $23,700 | $5,530 | $18,170 |
| 2015 | $1,131 | $23,700 | $5,530 | $18,170 |
| 2014 | $1,113 | $23,700 | $5,530 | $18,170 |
| 2013 | $1,190 | $24,060 | $4,800 | $19,260 |
Source: Public Records
Map
Nearby Homes
- 332 Wooster Rd
- 19 Avalon Rd
- 0 Miami St
- 6 Fairway Dr
- 13 Eastgate Dr
- 612 N Clinton St
- 1 Hilltop Dr
- 419 E Pleasant St
- 418 E Pleasant St
- 26-30 Dogwood Terrace
- 23 Upland Terrace
- 200 Eastwood Dr
- 28 Upland Terrace
- 111 E Lamartine St
- 213 Coshocton Ave
- 608 N Gay St
- 108 Ringold St
- 107 E Lamartine St
- 220 Coshocton Ave
- 208 E Burgess St
- 231 Sychar Rd
- 224 Sychar Rd
- 228 Sychar Rd
- 222 Sychar Rd
- 230 Sychar Rd
- 301 Sychar Rd
- 15 Old Orchard Dr
- 2 Willow Street Extension
- 305 Sychar Rd
- 216 Sychar Rd
- 6 Willow St
- 6 Willow St Unit Ext
- 14 Old Orchard Dr
- 304 Sychar Rd
- 4 Willow Street Extension
- 8 Willow St
- 13 Old Orchard Dr
- 307 Sychar Rd
- 12 Old Orchard Dr
- 214 Sychar Rd
Your Personal Tour Guide
Ask me questions while you tour the home.