
Landlord's Agent in 2025
Jyothi Kalra
Urban Circle Realty
(508) 816-2393
1 in this area
12 Total Sales


Estimated Value: $473,061 - $511,000
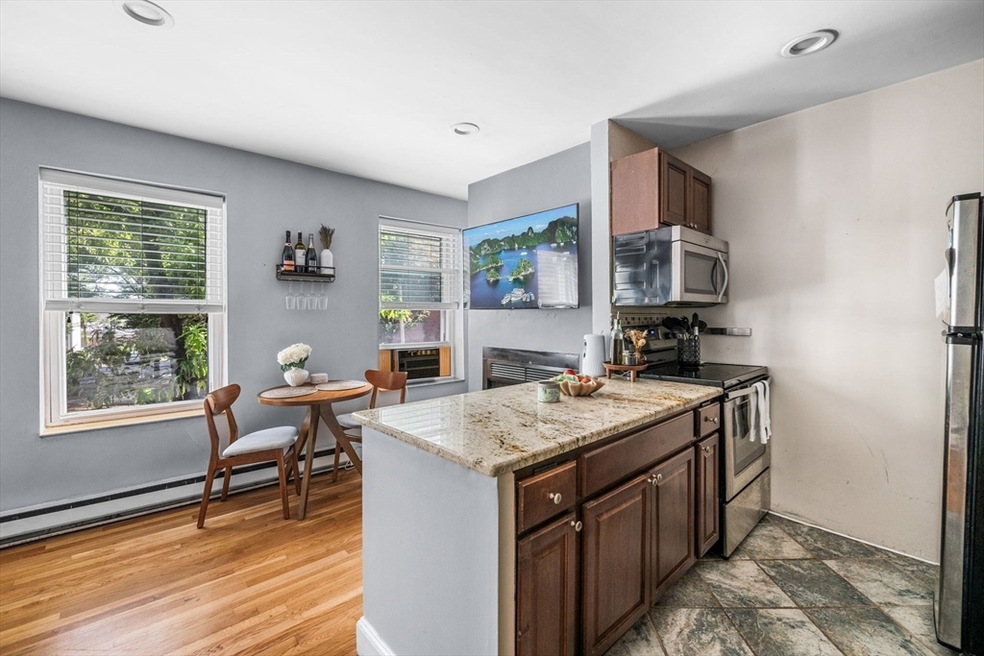
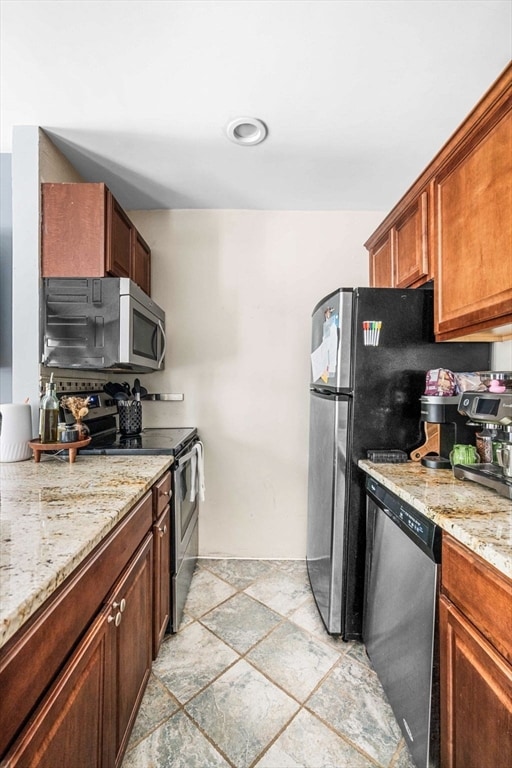
This amazing 2nd floor 1 bedroom, 1 bathroom rental is conveniently located on the west side of South Boston, less than a mile from the Seaport, only steps to dining and shopping, and a quick walk to the Broadway MBTA Station! This unit boasts gleaming hardwood floors, granite countertops, stainless steel appliances, AND a wood burning fireplace! The large master bedroom also includes a spacious custom closet and it's own access to the deck! Skip the laundromat - this unit also includes laundry facilities in the basement! Call or text for this great rental!
| Date | Buyer | Sale Price | Title Company |
|---|---|---|---|
| Sheldon Eleanor | $205,500 | -- |
| Date | Event | Price | List to Sale | Price per Sq Ft | Prior Sale |
|---|---|---|---|---|---|
| 10/08/2025 10/08/25 | Rented | $2,500 | 0.0% | -- | |
| 09/26/2025 09/26/25 | Price Changed | $2,500 | -3.8% | $5 / Sq Ft | |
| 09/10/2025 09/10/25 | Price Changed | $2,600 | -7.1% | $5 / Sq Ft | |
| 08/21/2025 08/21/25 | Price Changed | $2,800 | -5.1% | $6 / Sq Ft | |
| 08/04/2025 08/04/25 | For Rent | $2,950 | +9.3% | -- | |
| 08/09/2024 08/09/24 | Rented | $2,700 | 0.0% | -- | |
| 08/05/2024 08/05/24 | For Rent | $2,700 | +5.9% | -- | |
| 09/11/2023 09/11/23 | Rented | $2,550 | 0.0% | -- | |
| 09/02/2023 09/02/23 | Price Changed | $2,550 | -1.9% | $5 / Sq Ft | |
| 08/14/2023 08/14/23 | Price Changed | $2,600 | -1.9% | $5 / Sq Ft | |
| 07/18/2023 07/18/23 | For Rent | $2,650 | 0.0% | -- | |
| 07/17/2023 07/17/23 | Under Contract | -- | -- | -- | |
| 07/07/2023 07/07/23 | For Rent | $2,650 | +3.9% | -- | |
| 09/13/2022 09/13/22 | Rented | $2,550 | 0.0% | -- | |
| 09/12/2022 09/12/22 | Under Contract | -- | -- | -- | |
| 09/06/2022 09/06/22 | For Rent | $2,550 | +41.7% | -- | |
| 01/01/2021 01/01/21 | Rented | -- | -- | -- | |
| 12/22/2020 12/22/20 | Under Contract | -- | -- | -- | |
| 12/10/2020 12/10/20 | Price Changed | $1,800 | -5.3% | $4 / Sq Ft | |
| 11/18/2020 11/18/20 | Price Changed | $1,900 | -13.6% | $4 / Sq Ft | |
| 11/09/2020 11/09/20 | Price Changed | $2,200 | -12.0% | $4 / Sq Ft | |
| 11/05/2020 11/05/20 | For Rent | $2,500 | +2.0% | -- | |
| 01/01/2020 01/01/20 | Rented | $2,450 | -2.0% | -- | |
| 12/16/2019 12/16/19 | Under Contract | -- | -- | -- | |
| 11/14/2019 11/14/19 | Price Changed | $2,500 | -7.4% | $5 / Sq Ft | |
| 11/13/2019 11/13/19 | For Rent | $2,700 | 0.0% | -- | |
| 07/29/2016 07/29/16 | Sold | $360,000 | +12.9% | $735 / Sq Ft | View Prior Sale |
| 06/21/2016 06/21/16 | Pending | -- | -- | -- | |
| 06/16/2016 06/16/16 | For Sale | $319,000 | +22.2% | $651 / Sq Ft | |
| 05/28/2014 05/28/14 | Sold | $261,100 | 0.0% | $522 / Sq Ft | View Prior Sale |
| 04/02/2014 04/02/14 | Pending | -- | -- | -- | |
| 03/14/2014 03/14/14 | Off Market | $261,100 | -- | -- | |
| 03/11/2014 03/11/14 | For Sale | $249,000 | -- | $498 / Sq Ft |
| Year | Tax Paid | Tax Assessment Tax Assessment Total Assessment is a certain percentage of the fair market value that is determined by local assessors to be the total taxable value of land and additions on the property. | Land | Improvement |
|---|---|---|---|---|
| 2025 | $5,045 | $435,700 | $0 | $435,700 |
| 2024 | $4,843 | $444,300 | $0 | $444,300 |
| 2023 | $4,633 | $431,400 | $0 | $431,400 |
| 2022 | $4,557 | $418,800 | $0 | $418,800 |
| 2021 | $4,469 | $418,800 | $0 | $418,800 |
| 2020 | $3,597 | $340,600 | $0 | $340,600 |
| 2019 | $3,324 | $315,400 | $0 | $315,400 |
| 2018 | $3,118 | $297,500 | $0 | $297,500 |
| 2017 | $2,918 | $275,500 | $0 | $275,500 |
| 2016 | $2,886 | $262,400 | $0 | $262,400 |
| 2015 | $2,611 | $215,600 | $0 | $215,600 |
| 2014 | $2,293 | $182,300 | $0 | $182,300 |
Landlord's Agent in 2025
Jyothi Kalra
Urban Circle Realty
(508) 816-2393
1 in this area
12 Total Sales
Buyer's Agent in 2022
Daniel O'Leary
Compass
(617) 500-9795
10 in this area
65 Total Sales
Seller's Agent in 2021
Leigh Gilmore
Gilmore Murphy Realty LLC
(617) 323-7330
3 in this area
37 Total Sales
Seller's Agent in 2016
Michael Sylvia
Terrier Real Estate
(617) 212-1900
2 in this area
2 Total Sales
K
Buyer's Agent in 2016
Kathryn Gustafson
Arborview Realty Inc.
Seller's Agent in 2014
Donna Charpentier
William Raveis R.E. & Home Services
(617) 470-6603
5 in this area
40 Total Sales
Source: MLS Property Information Network (MLS PIN)
MLS Number: 73413536
APN: SBOS-000000-000006-001575-000004
Disclaimer: Certain information contained herein is derived from information provided by parties other than Homes.com. All information provided is deemed reliable, but is not guaranteed to be accurate and should be independently verified.
![]() The property listing data and information, or the Images, set forth herein were provided to MLS Property Information Network, Inc. from third party sources, including sellers, lessors and public records, and were compiled by MLS Property Information Network, Inc. The property listing data and information, and the Images, are for the personal, non-commercial use of consumers having a good faith interest in purchasing or leasing listed properties of the type displayed to them and may not be used for any purpose other than to identify prospective properties which such consumers may have a good faith interest in purchasing or leasing. MLS Property Information Network, Inc. and its subscribers disclaim any and all representations and warranties as to the accuracy of the property listing data and information, or as to the accuracy of any of the Images, set forth herein.
The property listing data and information, or the Images, set forth herein were provided to MLS Property Information Network, Inc. from third party sources, including sellers, lessors and public records, and were compiled by MLS Property Information Network, Inc. The property listing data and information, and the Images, are for the personal, non-commercial use of consumers having a good faith interest in purchasing or leasing listed properties of the type displayed to them and may not be used for any purpose other than to identify prospective properties which such consumers may have a good faith interest in purchasing or leasing. MLS Property Information Network, Inc. and its subscribers disclaim any and all representations and warranties as to the accuracy of the property listing data and information, or as to the accuracy of any of the Images, set forth herein.
Ask me questions while you tour the home.