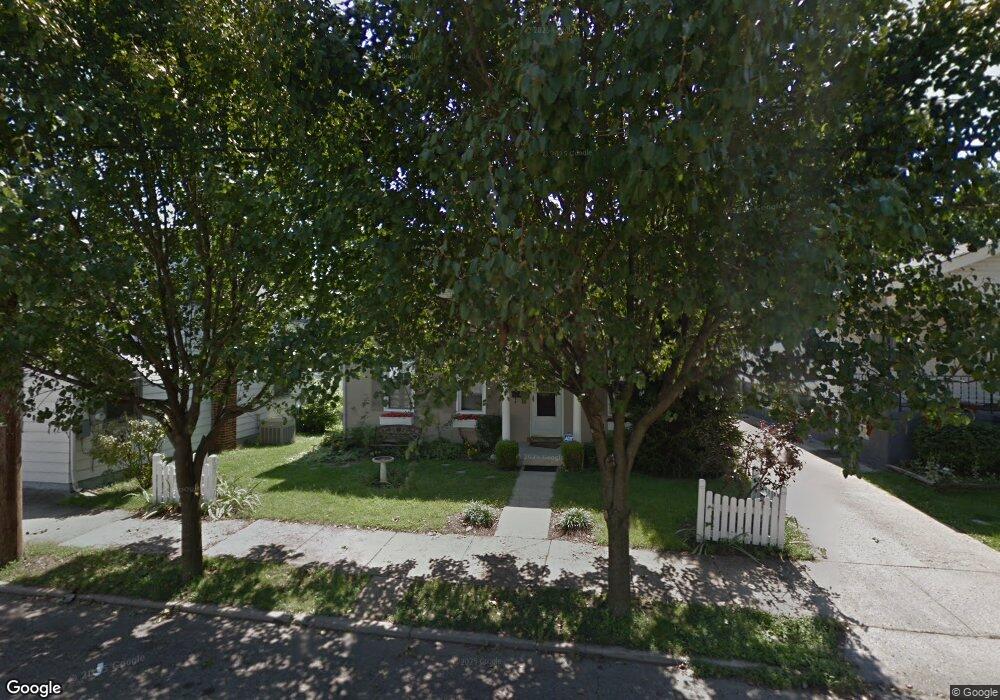
227 W Vine St Cincinnati, OH 45215
Estimated Value: $138,000 - $168,000
3
Beds
1
Bath
1,370
Sq Ft
$113/Sq Ft
Est. Value
About This Home
This home is located at 227 W Vine St, Cincinnati, OH 45215 and is currently estimated at $154,944, approximately $113 per square foot. 227 W Vine St is a home located in Hamilton County with nearby schools including Reading Community High School, Saints Peter and Paul Academy, and Mount Notre Dame High School.
Ownership History
Date
Name
Owned For
Owner Type
Purchase Details
Closed on
Jul 20, 2021
Sold by
Mcmahon Colleen and Greenwell James
Bought by
Dear Heart Revocable Trust
Current Estimated Value
Purchase Details
Closed on
Nov 18, 2004
Sold by
Heap Richard E and Heap Billie C
Bought by
Greenwell Colleen M
Home Financials for this Owner
Home Financials are based on the most recent Mortgage that was taken out on this home.
Original Mortgage
$94,000
Outstanding Balance
$47,034
Interest Rate
5.82%
Mortgage Type
Unknown
Estimated Equity
$107,910
Purchase Details
Closed on
Sep 12, 2002
Sold by
Hud
Bought by
Heap Richard E and Heap Billie C
Purchase Details
Closed on
Feb 6, 2002
Sold by
King Carl L and King Barbara A
Bought by
Hud
Purchase Details
Closed on
Dec 3, 1996
Sold by
Meisman Dorothy A
Bought by
King Carl L and Hill Barbara A
Home Financials for this Owner
Home Financials are based on the most recent Mortgage that was taken out on this home.
Original Mortgage
$72,853
Interest Rate
7.85%
Mortgage Type
FHA
Create a Home Valuation Report for This Property
The Home Valuation Report is an in-depth analysis detailing your home's value as well as a comparison with similar homes in the area
Home Values in the Area
Average Home Value in this Area
Purchase History
| Date | Buyer | Sale Price | Title Company |
|---|---|---|---|
| Dear Heart Revocable Trust | -- | None Available | |
| Greenwell Colleen M | $117,500 | -- | |
| Heap Richard E | $55,500 | Contract Processing & Title | |
| Hud | $52,000 | -- | |
| King Carl L | $72,900 | -- |
Source: Public Records
Mortgage History
| Date | Status | Borrower | Loan Amount |
|---|---|---|---|
| Open | Greenwell Colleen M | $94,000 | |
| Previous Owner | King Carl L | $72,853 |
Source: Public Records
Tax History Compared to Growth
Tax History
| Year | Tax Paid | Tax Assessment Tax Assessment Total Assessment is a certain percentage of the fair market value that is determined by local assessors to be the total taxable value of land and additions on the property. | Land | Improvement |
|---|---|---|---|---|
| 2024 | $1,930 | $37,279 | $5,723 | $31,556 |
| 2023 | $1,959 | $37,279 | $5,723 | $31,556 |
| 2022 | $1,474 | $21,743 | $4,603 | $17,140 |
| 2021 | $1,230 | $21,743 | $4,603 | $17,140 |
| 2020 | $1,244 | $21,743 | $4,603 | $17,140 |
| 2019 | $1,205 | $19,243 | $4,074 | $15,169 |
| 2018 | $1,207 | $19,243 | $4,074 | $15,169 |
| 2017 | $1,137 | $19,243 | $4,074 | $15,169 |
| 2016 | $1,422 | $24,140 | $4,316 | $19,824 |
| 2015 | $1,435 | $24,140 | $4,316 | $19,824 |
| 2014 | $1,256 | $24,140 | $4,316 | $19,824 |
| 2013 | $1,272 | $24,633 | $4,403 | $20,230 |
Source: Public Records
Map
Nearby Homes
- 134 Walnut St
- 116 Pike St
- 1013 Market St
- 1421 Jefferson Ave
- 327 Cooper St
- 8914 Reading Rd
- 653 Harmes Ave
- 310 E Vine St
- 1009 5th St
- 9 W North St
- 797 4th St
- 8745 Reading Rd
- 1521 Hunt Rd
- 122 Gebert St
- 415 Arlington Ave
- 334 Williams St
- 217 W Wyoming Ave
- 16 Gahl Terrace
- 18 Gahl Terrace
- 0 Hill St Unit 1616370