Estimated Value: $831,312 - $1,059,000
4
Beds
3
Baths
1,754
Sq Ft
$514/Sq Ft
Est. Value
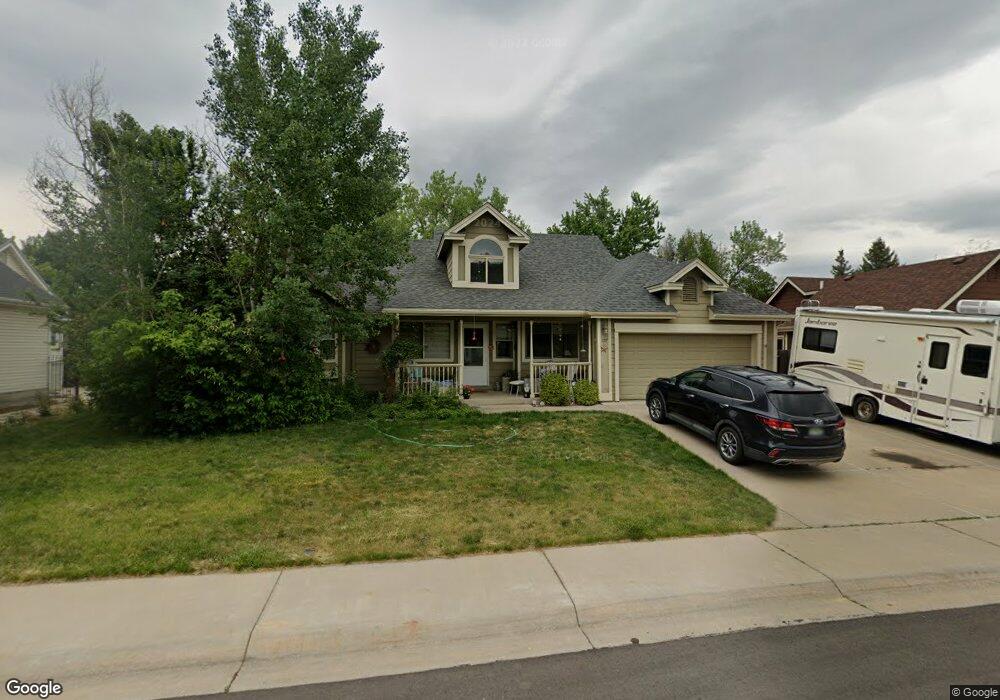
About This Home
This home is located at 227 Welch Dr, Lyons, CO 80540 and is currently estimated at $901,328, approximately $513 per square foot. 227 Welch Dr is a home with nearby schools including Lyons Elementary School and Lyons Middle/Senior High School.
Ownership History
Date
Name
Owned For
Owner Type
Purchase Details
Closed on
Apr 19, 2000
Sold by
Dominick Bane James Andrew and Dominick Brenda
Bought by
Biesiada Matthew D and Biesiada Erin J
Current Estimated Value
Home Financials for this Owner
Home Financials are based on the most recent Mortgage that was taken out on this home.
Original Mortgage
$248,000
Outstanding Balance
$81,166
Interest Rate
8.24%
Mortgage Type
Stand Alone First
Estimated Equity
$820,162
Purchase Details
Closed on
Dec 28, 1998
Sold by
Bane James Andrew
Bought by
Bane James Andrew
Home Financials for this Owner
Home Financials are based on the most recent Mortgage that was taken out on this home.
Original Mortgage
$217,000
Interest Rate
6.74%
Purchase Details
Closed on
Feb 27, 1997
Sold by
Carnahan William K and Carnahan Diane M
Bought by
Bane James Andrew
Home Financials for this Owner
Home Financials are based on the most recent Mortgage that was taken out on this home.
Original Mortgage
$211,300
Interest Rate
7.88%
Create a Home Valuation Report for This Property
The Home Valuation Report is an in-depth analysis detailing your home's value as well as a comparison with similar homes in the area
Purchase History
| Date | Buyer | Sale Price | Title Company |
|---|---|---|---|
| Biesiada Matthew D | $310,000 | Land Title | |
| Bane James Andrew | -- | Land Title | |
| Bane James Andrew | $222,500 | Land Title |
Source: Public Records
Mortgage History
| Date | Status | Borrower | Loan Amount |
|---|---|---|---|
| Open | Biesiada Matthew D | $248,000 | |
| Previous Owner | Bane James Andrew | $217,000 | |
| Previous Owner | Bane James Andrew | $211,300 | |
| Closed | Biesiada Matthew D | $46,500 |
Source: Public Records
Tax History
| Year | Tax Paid | Tax Assessment Tax Assessment Total Assessment is a certain percentage of the fair market value that is determined by local assessors to be the total taxable value of land and additions on the property. | Land | Improvement |
|---|---|---|---|---|
| 2025 | $6,507 | $51,875 | $4,519 | $47,356 |
| 2024 | $6,507 | $51,875 | $4,519 | $47,356 |
| 2023 | $6,420 | $54,719 | $4,201 | $54,203 |
| 2022 | $5,599 | $45,411 | $3,843 | $41,568 |
| 2021 | $5,531 | $46,718 | $3,954 | $42,764 |
| 2020 | $4,898 | $40,991 | $10,082 | $30,909 |
| 2019 | $4,800 | $40,991 | $10,082 | $30,909 |
| 2018 | $4,055 | $35,316 | $10,152 | $25,164 |
| 2017 | $3,988 | $39,044 | $11,224 | $27,820 |
| 2016 | $3,864 | $33,312 | $9,711 | $23,601 |
| 2015 | $3,673 | $28,171 | $4,219 | $23,952 |
| 2014 | $2,920 | $28,171 | $4,219 | $23,952 |
Source: Public Records
Map
Nearby Homes
- 104 Noland Ct
- 350 Mcconnell Dr
- 430 Carter Dr
- 121 Osprey Ln
- 342 4th Ave
- 618 Overlook Dr
- 17667 Route 7
- 18673 Route 7
- 125 Longs Peak Dr
- 223 Stone Canyon Rd
- 1040 5th Ave 2 and 4
- 1040 5th Ave 5
- 0 Apple Valley Rd
- 1117 5th Ave
- 1117 N 5th Ave
- 119 Eagle Canyon Cir
- 2615 Eagle Ridge Rd
- 2685 Eagle Ridge Rd
- 1285 Eagle Ridge Rd
- 11730 Pointe View Dr
Your Personal Tour Guide
Ask me questions while you tour the home.