J
Landlord's Agent in 2016
Jimmy Tian
Universal Properties Realty
Estimated Value: $391,000 - $455,000
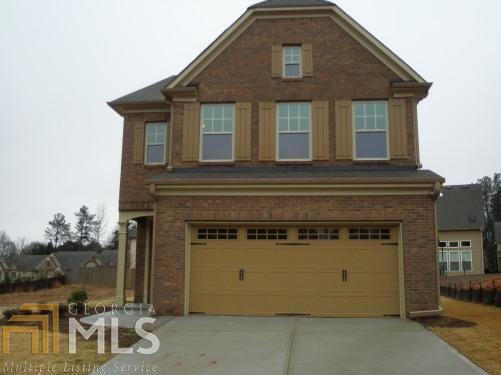
Beautiful 3 bedrooms plus a loft, 2.5 baths single house in a great community. 2 car garage with openers Spacious family room with fireplace. Gorgeous gourmet kitchen with breakfast area. Spacious bedrooms. The loft can be an office or fourth bedroom. Great schools: Harmony Elementary, GC Jones Middle, Mill Creek High. Close to Mall of GA, I85 and I985. Owner pays HOA fee.
Last Agent to Rent the Property
Jimmy Tian
Universal Properties Realty License #174726 Listed on: 03/03/2016
| Date | Buyer | Sale Price | Title Company |
|---|---|---|---|
| Davis Shan J | $155,000 | -- | |
| Doubel Time Dev Inc | -- | -- | |
| Bowen Family Homes Inc | $40,000 | -- |
| Date | Status | Borrower | Loan Amount |
|---|---|---|---|
| Previous Owner | Bowen Family Homes Inc | $135,000 |
| Date | Event | Price | List to Sale | Price per Sq Ft |
|---|---|---|---|---|
| 03/03/2016 03/03/16 | Rented | $1,400 | 0.0% | -- |
| 03/03/2016 03/03/16 | For Rent | $1,400 | 0.0% | -- |
| 08/28/2015 08/28/15 | Rented | $1,400 | 0.0% | -- |
| 08/28/2015 08/28/15 | For Rent | $1,400 | +7.7% | -- |
| 02/24/2014 02/24/14 | Rented | $1,300 | 0.0% | -- |
| 01/25/2014 01/25/14 | Under Contract | -- | -- | -- |
| 12/08/2013 12/08/13 | For Rent | $1,300 | 0.0% | -- |
| 05/10/2013 05/10/13 | Rented | $1,300 | 0.0% | -- |
| 04/10/2013 04/10/13 | Under Contract | -- | -- | -- |
| 03/18/2013 03/18/13 | For Rent | $1,300 | -- | -- |
| Year | Tax Paid | Tax Assessment Tax Assessment Total Assessment is a certain percentage of the fair market value that is determined by local assessors to be the total taxable value of land and additions on the property. | Land | Improvement |
|---|---|---|---|---|
| 2024 | $6,177 | $164,920 | $36,000 | $128,920 |
| 2023 | $6,177 | $164,920 | $36,000 | $128,920 |
| 2022 | $0 | $117,160 | $27,600 | $89,560 |
| 2021 | $3,715 | $94,920 | $20,880 | $74,040 |
| 2020 | $3,736 | $94,920 | $20,880 | $74,040 |
| 2019 | $3,600 | $94,920 | $20,880 | $74,040 |
| 2018 | $3,071 | $79,760 | $18,400 | $61,360 |
| 2016 | $2,742 | $69,880 | $14,000 | $55,880 |
| 2015 | $2,773 | $69,880 | $14,000 | $55,880 |
| 2014 | $2,580 | $64,440 | $14,000 | $50,440 |
J
Landlord's Agent in 2016
Jimmy Tian
Universal Properties Realty

Tenant's Agent in 2016
Glenda Broker
Non-Mls Company
(800) 289-1214
H
Seller's Agent in 2014
Hsin-Hui Yu
Universal Properties Realty
Source: Georgia MLS
MLS Number: 7598761
APN: 7-186-237
Disclaimer: Certain information contained herein is derived from information provided by parties other than Homes.com. All information provided is deemed reliable, but is not guaranteed to be accurate and should be independently verified.
![]() The data relating to real estate for sale on this web site comes in part from the Broker Reciprocity Program of Georgia MLS. Real estate listings held by brokerage firms other than Redfin are marked with the Broker Reciprocity logo and detailed information about them includes the name of the listing brokers. Information deemed reliable but not guaranteed. Copyright 2025 Georgia MLS. All rights reserved.
The data relating to real estate for sale on this web site comes in part from the Broker Reciprocity Program of Georgia MLS. Real estate listings held by brokerage firms other than Redfin are marked with the Broker Reciprocity logo and detailed information about them includes the name of the listing brokers. Information deemed reliable but not guaranteed. Copyright 2025 Georgia MLS. All rights reserved.