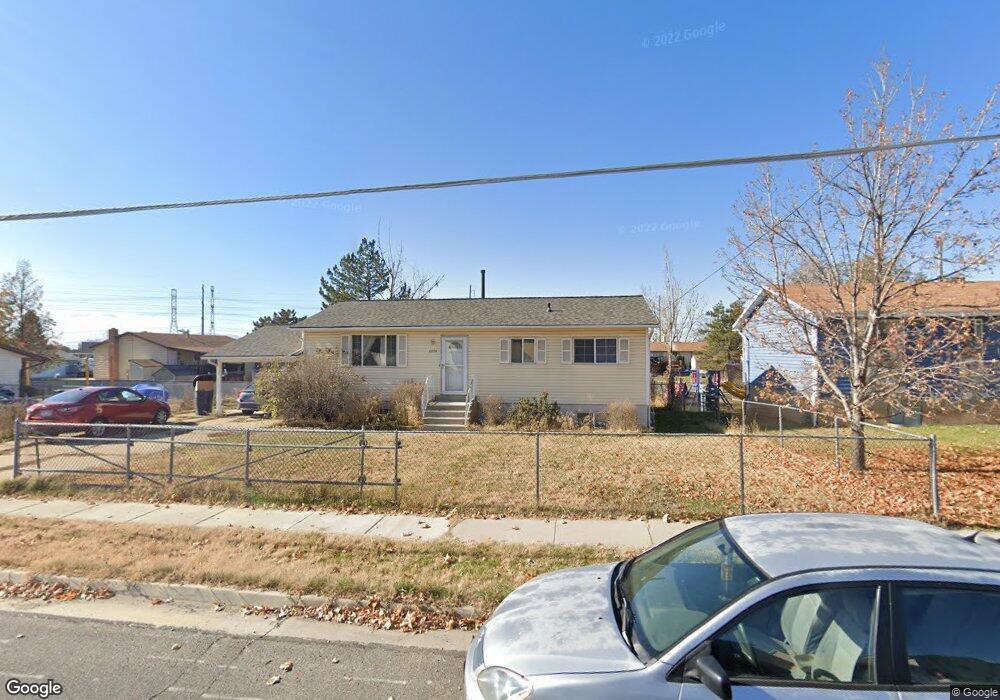
2270 S Main St Clearfield, UT 84015
Estimated Value: $440,919 - $462,000
5
Beds
2
Baths
1,347
Sq Ft
$333/Sq Ft
Est. Value
About This Home
This home is located at 2270 S Main St, Clearfield, UT 84015 and is currently estimated at $448,230, approximately $332 per square foot. 2270 S Main St is a home located in Davis County with nearby schools including Antelope Elementary School, North Davis Junior High School, and Clearfield High School.
Ownership History
Date
Name
Owned For
Owner Type
Purchase Details
Closed on
Jun 17, 2005
Sold by
Oppedahl Joyce D and Oppedahl Joyce
Bought by
Oppedahl Joyce
Current Estimated Value
Home Financials for this Owner
Home Financials are based on the most recent Mortgage that was taken out on this home.
Original Mortgage
$109,600
Interest Rate
5.72%
Mortgage Type
Fannie Mae Freddie Mac
Purchase Details
Closed on
Apr 24, 1997
Sold by
Dunbar Stanley C
Bought by
Dunbar Joyce D
Home Financials for this Owner
Home Financials are based on the most recent Mortgage that was taken out on this home.
Original Mortgage
$75,750
Interest Rate
7.86%
Create a Home Valuation Report for This Property
The Home Valuation Report is an in-depth analysis detailing your home's value as well as a comparison with similar homes in the area
Home Values in the Area
Average Home Value in this Area
Purchase History
| Date | Buyer | Sale Price | Title Company |
|---|---|---|---|
| Oppedahl Joyce | -- | Equity Title Ins Agency Inc | |
| Dunbar Joyce D | -- | Mountain View Title & Escrow |
Source: Public Records
Mortgage History
| Date | Status | Borrower | Loan Amount |
|---|---|---|---|
| Closed | Oppedahl Joyce | $109,600 | |
| Closed | Dunbar Joyce D | $75,750 |
Source: Public Records
Tax History Compared to Growth
Tax History
| Year | Tax Paid | Tax Assessment Tax Assessment Total Assessment is a certain percentage of the fair market value that is determined by local assessors to be the total taxable value of land and additions on the property. | Land | Improvement |
|---|---|---|---|---|
| 2025 | $2,522 | $226,050 | $72,093 | $153,957 |
| 2024 | $2,431 | $219,450 | $68,925 | $150,525 |
| 2023 | $2,239 | $371,000 | $110,323 | $260,677 |
| 2022 | $2,363 | $211,750 | $63,209 | $148,541 |
| 2021 | $2,039 | $276,000 | $67,057 | $208,943 |
| 2020 | $1,770 | $238,000 | $56,367 | $181,633 |
| 2019 | $1,703 | $226,000 | $59,172 | $166,828 |
| 2018 | $1,485 | $192,000 | $52,521 | $139,479 |
| 2016 | $1,282 | $86,680 | $20,970 | $65,710 |
| 2015 | $1,219 | $78,595 | $20,970 | $57,625 |
| 2014 | $1,199 | $78,353 | $20,970 | $57,383 |
| 2013 | -- | $63,409 | $23,653 | $39,756 |
Source: Public Records
Map
Nearby Homes