Estimated Value: $734,000 - $879,000
3
Beds
3
Baths
3,671
Sq Ft
$215/Sq Ft
Est. Value
About This Home
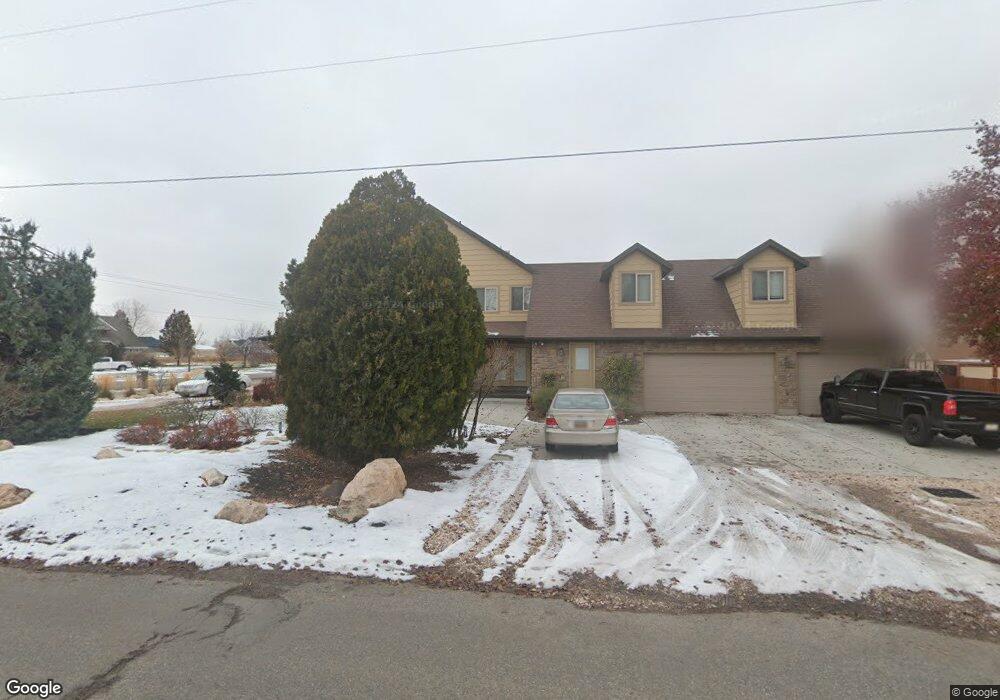
This home is located at 2270 W 200 S, Ogden, UT 84404 and is currently estimated at $790,520, approximately $215 per square foot. 2270 W 200 S is a home located in Weber County with nearby schools including West Weber School, Fremont High School, and Venture Academy.
Ownership History
Date
Name
Owned For
Owner Type
Purchase Details
Closed on
Sep 25, 2020
Sold by
Taylor David A and Taylor Kimberli J
Bought by
Taylor David and Taylor Kimberli
Current Estimated Value
Home Financials for this Owner
Home Financials are based on the most recent Mortgage that was taken out on this home.
Original Mortgage
$355,000
Outstanding Balance
$249,254
Interest Rate
2.5%
Mortgage Type
New Conventional
Estimated Equity
$541,266
Purchase Details
Closed on
Jun 7, 2012
Sold by
Taylor Jacob H
Bought by
Taylor David A and Taylor Kimberli J
Home Financials for this Owner
Home Financials are based on the most recent Mortgage that was taken out on this home.
Original Mortgage
$279,750
Interest Rate
3.74%
Mortgage Type
New Conventional
Purchase Details
Closed on
Jan 29, 2008
Sold by
Taylor Gerald F and Taylor Joan C
Bought by
Taylor David A and Taylor Kimberli J
Create a Home Valuation Report for This Property
The Home Valuation Report is an in-depth analysis detailing your home's value as well as a comparison with similar homes in the area
Home Values in the Area
Average Home Value in this Area
Purchase History
| Date | Buyer | Sale Price | Title Company |
|---|---|---|---|
| Taylor David | -- | First American Title Ins Co | |
| Taylor David A | -- | Bonneville Superior Title Co | |
| Taylor David A | -- | None Available |
Source: Public Records
Mortgage History
| Date | Status | Borrower | Loan Amount |
|---|---|---|---|
| Open | Taylor David | $355,000 | |
| Closed | Taylor David A | $279,750 |
Source: Public Records
Tax History Compared to Growth
Tax History
| Year | Tax Paid | Tax Assessment Tax Assessment Total Assessment is a certain percentage of the fair market value that is determined by local assessors to be the total taxable value of land and additions on the property. | Land | Improvement |
|---|---|---|---|---|
| 2025 | $4,135 | $744,813 | $136,991 | $607,822 |
| 2024 | $3,978 | $401,499 | $75,351 | $326,148 |
| 2023 | $3,756 | $375,650 | $86,924 | $288,726 |
| 2022 | $3,554 | $363,550 | $86,924 | $276,626 |
| 2021 | $2,918 | $506,000 | $90,565 | $415,435 |
| 2020 | $2,897 | $461,000 | $40,692 | $420,308 |
| 2019 | $3,004 | $452,000 | $36,278 | $415,722 |
| 2018 | $3,130 | $451,000 | $36,278 | $414,722 |
| 2017 | $3,113 | $436,000 | $32,776 | $403,224 |
| 2016 | $3,160 | $239,539 | $18,935 | $220,604 |
| 2015 | $2,826 | $211,388 | $20,610 | $190,778 |
| 2014 | $2,615 | $190,953 | $25,059 | $165,894 |
Source: Public Records
Map
Nearby Homes
- 2425 W 200 S
- 2445 W 200 S
- 417 S 2025 W
- 1917 W 250 N
- 377 N 1900 St W
- 2390 W Pioneer Rd
- 1765 W 650 S
- 928 N 2075 W
- 599 S 1325 W
- 1111 N 2000 W Unit 52
- 1111 N 2000 W Unit 123
- 1111 N 2000 W Unit 335
- 1111 N 2000 W Unit 170
- 1111 N 2000 W Unit 222
- 1111 N 2000 W Unit 404
- 1111 N 2000 W Unit 84
- 1111 N 2000 W Unit 201
- 1111 N 2000 W Unit 197
- 1111 N 2000 W Unit 155
- 1111 N 2000 W Unit 21