Estimated Value: $446,391 - $492,000
3
Beds
3
Baths
2,422
Sq Ft
$194/Sq Ft
Est. Value
About This Home
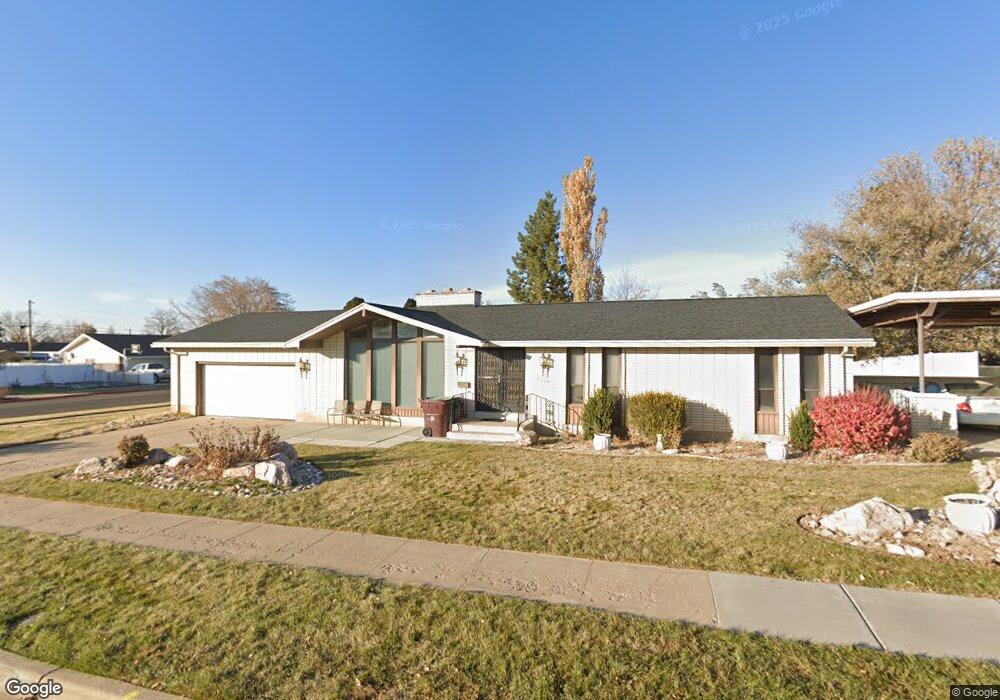
This home is located at 2270 W 4975 S, Roy, UT 84067 and is currently estimated at $469,098, approximately $193 per square foot. 2270 W 4975 S is a home located in Weber County with nearby schools including Lakeview Elementary School, Roy Junior High School, and Roy High School.
Ownership History
Date
Name
Owned For
Owner Type
Purchase Details
Closed on
Jan 5, 2023
Sold by
Page Jan E
Bought by
Jan & Lori Page Family Trust
Current Estimated Value
Purchase Details
Closed on
Feb 24, 2022
Sold by
Page Lori A
Bought by
Page Lori Ann and Page Jan E
Home Financials for this Owner
Home Financials are based on the most recent Mortgage that was taken out on this home.
Original Mortgage
$200,000
Interest Rate
3.92%
Mortgage Type
Credit Line Revolving
Purchase Details
Closed on
Jan 14, 2022
Sold by
Doncene Sosa
Bought by
Page Lori A and Page Jan E
Home Financials for this Owner
Home Financials are based on the most recent Mortgage that was taken out on this home.
Original Mortgage
$200,000
Interest Rate
3.92%
Mortgage Type
Credit Line Revolving
Purchase Details
Closed on
May 10, 2000
Sold by
Bird Kay Vernon and Bird Sharon A
Bought by
Sosa Lee A and Sosa Doncene
Create a Home Valuation Report for This Property
The Home Valuation Report is an in-depth analysis detailing your home's value as well as a comparison with similar homes in the area
Home Values in the Area
Average Home Value in this Area
Purchase History
| Date | Buyer | Sale Price | Title Company |
|---|---|---|---|
| Jan & Lori Page Family Trust | -- | None Listed On Document | |
| Page Lori Ann | -- | Backman Title Services | |
| Page Lori A | -- | None Listed On Document | |
| Sosa Lee A | -- | Associated Title |
Source: Public Records
Mortgage History
| Date | Status | Borrower | Loan Amount |
|---|---|---|---|
| Previous Owner | Page Lori Ann | $200,000 |
Source: Public Records
Tax History
| Year | Tax Paid | Tax Assessment Tax Assessment Total Assessment is a certain percentage of the fair market value that is determined by local assessors to be the total taxable value of land and additions on the property. | Land | Improvement |
|---|---|---|---|---|
| 2025 | $2,807 | $446,087 | $128,515 | $317,572 |
| 2024 | $2,664 | $425,000 | $128,516 | $296,484 |
| 2023 | $2,629 | $421,000 | $121,188 | $299,812 |
| 2022 | $2,935 | $268,400 | $60,611 | $207,789 |
| 2021 | $2,229 | $332,000 | $73,729 | $258,271 |
| 2020 | $2,065 | $282,000 | $73,729 | $208,271 |
| 2019 | $2,103 | $272,000 | $43,199 | $228,801 |
| 2018 | $1,930 | $234,000 | $39,930 | $194,070 |
| 2017 | $1,776 | $201,000 | $39,930 | $161,070 |
| 2016 | $1,773 | $108,386 | $19,926 | $88,460 |
| 2015 | $1,722 | $108,386 | $19,926 | $88,460 |
| 2014 | $1,737 | $108,386 | $17,039 | $91,347 |
Source: Public Records
Map
Nearby Homes
Your Personal Tour Guide
Ask me questions while you tour the home.