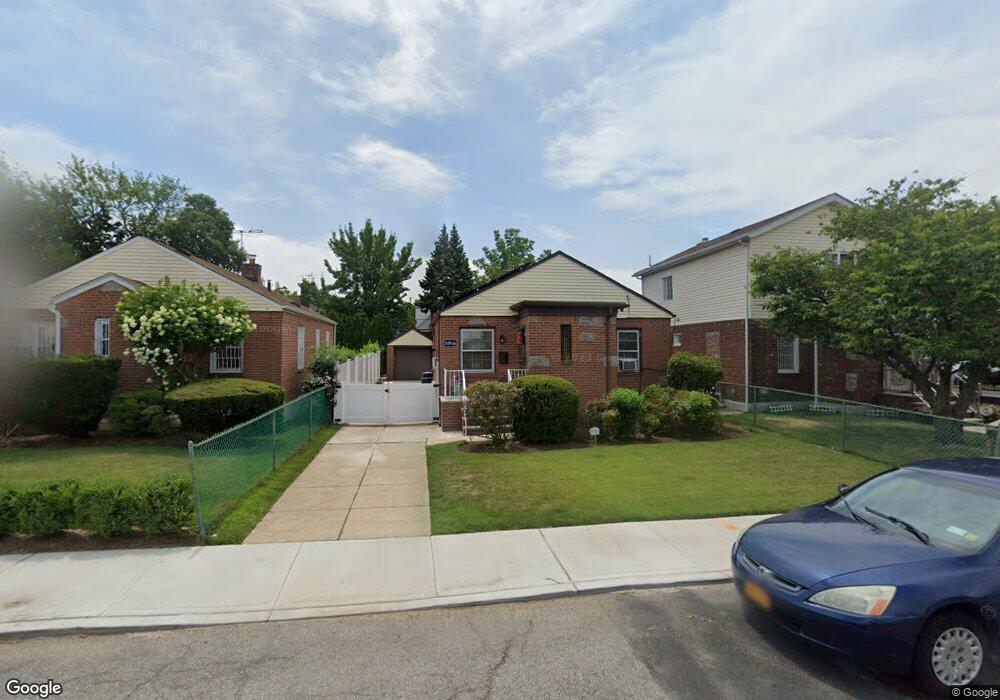
22706 113th Dr Queens Village, NY 11429
Queens Village NeighborhoodEstimated Value: $568,787 - $701,000
--
Bed
--
Bath
672
Sq Ft
$934/Sq Ft
Est. Value
About This Home
This home is located at 22706 113th Dr, Queens Village, NY 11429 and is currently estimated at $627,447, approximately $933 per square foot. 22706 113th Dr is a home located in Queens County with nearby schools including P.S./M.S. 147 Ronald Mcnair, I.S. 192 The Linden, and Ss Joachim & Anne School.
Ownership History
Date
Name
Owned For
Owner Type
Purchase Details
Closed on
Jul 28, 2025
Sold by
Shaw Stephanie
Bought by
Shaw Stephanie A and Stephanie A Shaw Legacy Trust
Current Estimated Value
Purchase Details
Closed on
Apr 10, 2009
Sold by
Bruce Audrey and Bruce Joanna
Bought by
Shaw Stephanie
Home Financials for this Owner
Home Financials are based on the most recent Mortgage that was taken out on this home.
Original Mortgage
$301,383
Outstanding Balance
$189,597
Interest Rate
4.93%
Mortgage Type
Purchase Money Mortgage
Estimated Equity
$437,850
Purchase Details
Closed on
Aug 18, 2006
Sold by
Felice Hannah
Bought by
Bruce Audrey and Bruce Joanna
Home Financials for this Owner
Home Financials are based on the most recent Mortgage that was taken out on this home.
Original Mortgage
$85,000
Interest Rate
6.83%
Create a Home Valuation Report for This Property
The Home Valuation Report is an in-depth analysis detailing your home's value as well as a comparison with similar homes in the area
Home Values in the Area
Average Home Value in this Area
Purchase History
| Date | Buyer | Sale Price | Title Company |
|---|---|---|---|
| Shaw Stephanie A | -- | -- | |
| Shaw Stephanie | $307,000 | -- | |
| Shaw Stephanie | $307,000 | -- | |
| Bruce Audrey | $425,000 | -- | |
| Bruce Audrey | $425,000 | -- |
Source: Public Records
Mortgage History
| Date | Status | Borrower | Loan Amount |
|---|---|---|---|
| Open | Shaw Stephanie | $301,383 | |
| Closed | Shaw Stephanie | $301,383 | |
| Previous Owner | Bruce Audrey | $85,000 | |
| Previous Owner | Bruce Audrey | $340,000 |
Source: Public Records
Tax History Compared to Growth
Tax History
| Year | Tax Paid | Tax Assessment Tax Assessment Total Assessment is a certain percentage of the fair market value that is determined by local assessors to be the total taxable value of land and additions on the property. | Land | Improvement |
|---|---|---|---|---|
| 2025 | $4,057 | $22,896 | $5,617 | $17,279 |
| 2024 | $4,069 | $21,600 | $5,935 | $15,665 |
| 2023 | $4,022 | $21,427 | $6,536 | $14,891 |
| 2022 | $2,357 | $29,460 | $9,480 | $19,980 |
| 2021 | $2,327 | $24,420 | $9,480 | $14,940 |
| 2020 | $2,109 | $26,820 | $9,480 | $17,340 |
| 2019 | $1,839 | $22,980 | $9,480 | $13,500 |
| 2018 | $3,342 | $17,856 | $6,915 | $10,941 |
| 2017 | $3,340 | $17,856 | $7,880 | $9,976 |
| 2016 | $3,059 | $17,856 | $7,880 | $9,976 |
| 2015 | $2,009 | $15,900 | $9,328 | $6,572 |
| 2014 | $2,009 | $15,000 | $10,560 | $4,440 |
Source: Public Records
Map
Nearby Homes
- 22554 Murdock Ave
- 225-53 Murdock Ave
- 22533 Murdock Ave
- 22524 Murdock Ave
- 225-23 Murdock Ave
- 22726 112th Rd
- 22734 112th Rd
- 22343 113th Dr
- 440 Parkway Dr
- 22722 112th Ave
- 2334 Belmont Ave
- 22324 Murdock Ave
- 224-06 114th Rd
- 114-67 226th St
- 114-66 225th St
- 11480 226th St
- 174 Wellington Rd
- 114-109 228th St
- 219 Locustwood Blvd
- 165 Heathcote Rd
- 227-10 113th Dr
- 22710 113th Dr
- 22702 113th Dr
- 22714 113th Dr
- 22707 114th Ave
- 227-07 114th Ave
- 22707 114th Ave
- 22703 114th Ave
- 22711 114th Ave
- 22718 113th Dr
- 225-46 113th Dr
- 22715 114th Ave
- 22546 113th Dr
- 227-01 113th Dr
- 22705 113th Dr
- 22722 113th Dr
- 227-13 113th Dr
- 22709 113th Dr
- 22701 113th Dr
- 22719 114th Ave