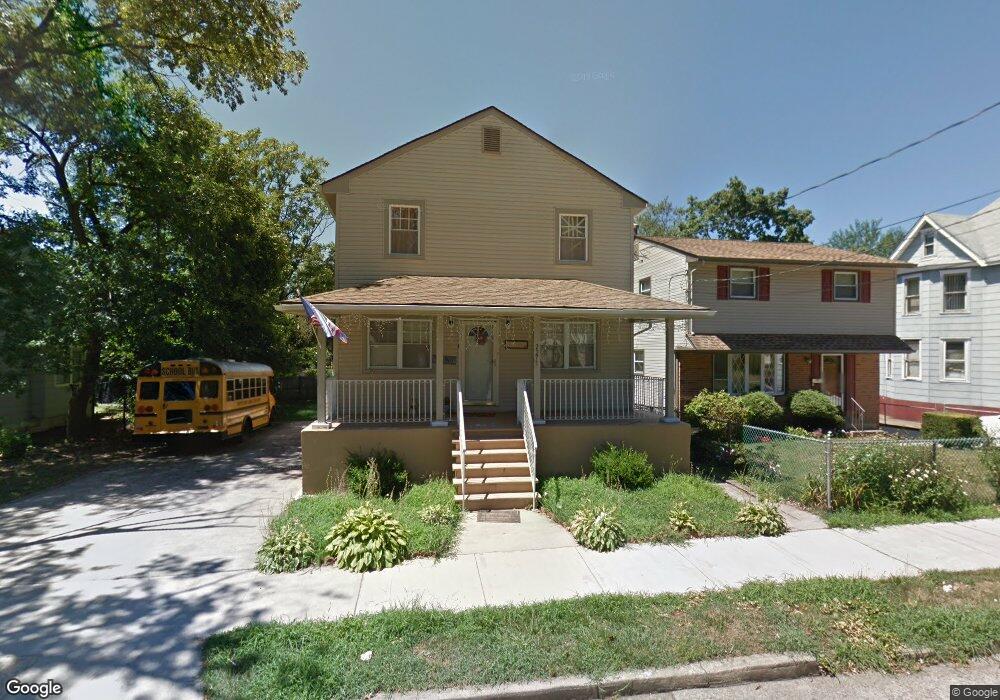
2271 41st St Pennsauken, NJ 08110
Estimated Value: $263,000 - $364,000
--
Bed
--
Bath
1,900
Sq Ft
$167/Sq Ft
Est. Value
About This Home
This home is located at 2271 41st St, Pennsauken, NJ 08110 and is currently estimated at $317,173, approximately $166 per square foot. 2271 41st St is a home located in Camden County with nearby schools including Pennsauken High School, St. Cecilia School, and Camden Forward School.
Ownership History
Date
Name
Owned For
Owner Type
Purchase Details
Closed on
Jul 26, 2006
Sold by
Nguyen Hung
Bought by
Roque Elizabeth
Current Estimated Value
Home Financials for this Owner
Home Financials are based on the most recent Mortgage that was taken out on this home.
Original Mortgage
$250,000
Outstanding Balance
$151,072
Interest Rate
6.88%
Estimated Equity
$166,101
Purchase Details
Closed on
Jun 23, 2005
Sold by
Quest Bldrs Inc
Bought by
Nguyen Hung
Purchase Details
Closed on
Jun 17, 2005
Sold by
Mims Joyce
Bought by
Quest Bldrs Inc
Create a Home Valuation Report for This Property
The Home Valuation Report is an in-depth analysis detailing your home's value as well as a comparison with similar homes in the area
Home Values in the Area
Average Home Value in this Area
Purchase History
| Date | Buyer | Sale Price | Title Company |
|---|---|---|---|
| Roque Elizabeth | $250,000 | -- | |
| Nguyen Hung | $42,000 | -- | |
| Quest Bldrs Inc | $26,000 | -- |
Source: Public Records
Mortgage History
| Date | Status | Borrower | Loan Amount |
|---|---|---|---|
| Open | Roque Elizabeth | $250,000 |
Source: Public Records
Tax History Compared to Growth
Tax History
| Year | Tax Paid | Tax Assessment Tax Assessment Total Assessment is a certain percentage of the fair market value that is determined by local assessors to be the total taxable value of land and additions on the property. | Land | Improvement |
|---|---|---|---|---|
| 2025 | $5,257 | $338,600 | $57,000 | $281,600 |
| 2024 | $5,156 | $120,800 | $36,500 | $84,300 |
| 2023 | $5,156 | $120,800 | $36,500 | $84,300 |
| 2022 | $4,662 | $120,800 | $36,500 | $84,300 |
| 2021 | $4,787 | $120,800 | $36,500 | $84,300 |
| 2020 | $4,288 | $120,800 | $36,500 | $84,300 |
| 2019 | $4,338 | $120,800 | $36,500 | $84,300 |
| 2018 | $4,361 | $120,800 | $36,500 | $84,300 |
| 2017 | $4,369 | $120,800 | $36,500 | $84,300 |
| 2016 | $4,291 | $120,800 | $36,500 | $84,300 |
| 2015 | $4,419 | $120,800 | $36,500 | $84,300 |
| 2014 | $4,377 | $78,700 | $17,000 | $61,700 |
Source: Public Records
Map
Nearby Homes