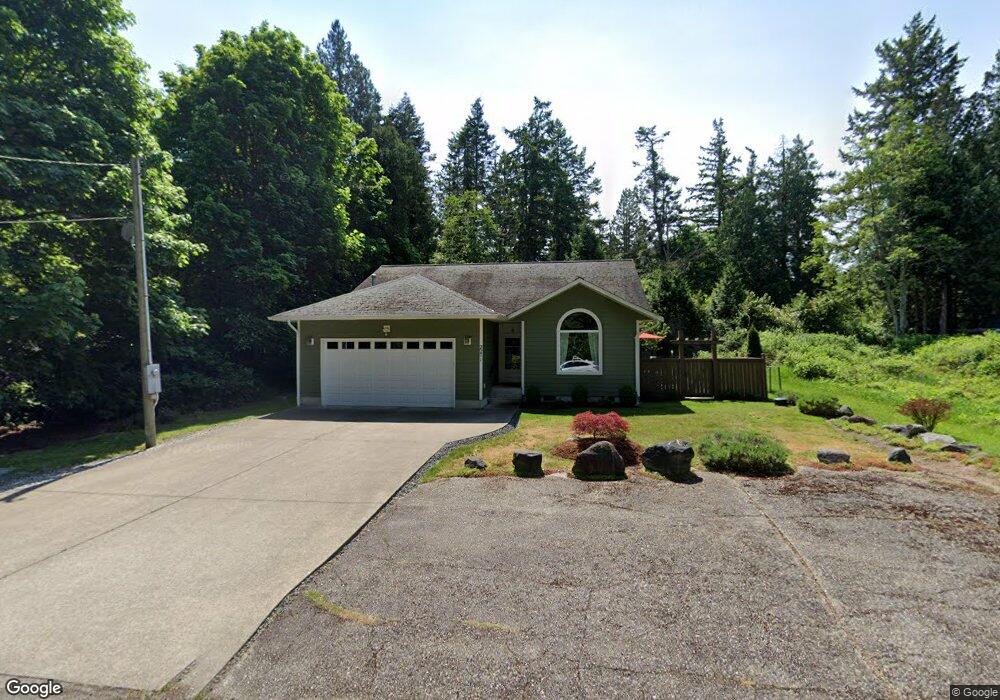
2271 Cedar Point Ave Point Roberts, WA 98281
Estimated Value: $432,000 - $726,000
3
Beds
2
Baths
1,471
Sq Ft
$365/Sq Ft
Est. Value
About This Home
This home is located at 2271 Cedar Point Ave, Point Roberts, WA 98281 and is currently estimated at $536,411, approximately $364 per square foot. 2271 Cedar Point Ave is a home located in Whatcom County with nearby schools including Point Roberts Primary School, Blaine Middle School, and Blaine High School.
Ownership History
Date
Name
Owned For
Owner Type
Purchase Details
Closed on
Nov 28, 2017
Sold by
Mcfarlane John L and Mcfarlane Amelia C
Bought by
Henchey Elizabeth and Henchey Elizabeth
Current Estimated Value
Purchase Details
Closed on
Nov 20, 2017
Sold by
Mcfarlane John L and Mcfarlane Amelia C
Bought by
Henchey Elizabeth and Henchey Elizabeth
Purchase Details
Closed on
Jan 8, 2005
Sold by
Lloyd Richard
Bought by
Mcfarlane John L and Mcfarlane Amelia C
Purchase Details
Closed on
Apr 28, 1999
Sold by
Skeffington Paul and Ross Stephanie
Bought by
Lloyd Richard Albert
Home Financials for this Owner
Home Financials are based on the most recent Mortgage that was taken out on this home.
Original Mortgage
$20,000
Interest Rate
6.98%
Create a Home Valuation Report for This Property
The Home Valuation Report is an in-depth analysis detailing your home's value as well as a comparison with similar homes in the area
Home Values in the Area
Average Home Value in this Area
Purchase History
| Date | Buyer | Sale Price | Title Company |
|---|---|---|---|
| Henchey Elizabeth | -- | None Available | |
| Henchey Elizabeth | -- | None Available | |
| Mcfarlane John L | $25,000 | Whatcom Land Title Co Inc | |
| Lloyd Richard Albert | -- | Whatcom Land Title Company I |
Source: Public Records
Mortgage History
| Date | Status | Borrower | Loan Amount |
|---|---|---|---|
| Previous Owner | Lloyd Richard Albert | $20,000 |
Source: Public Records
Tax History
| Year | Tax Paid | Tax Assessment Tax Assessment Total Assessment is a certain percentage of the fair market value that is determined by local assessors to be the total taxable value of land and additions on the property. | Land | Improvement |
|---|---|---|---|---|
| 2025 | $3,058 | $369,947 | $103,403 | $266,544 |
| 2024 | $2,970 | $366,276 | $102,383 | $263,893 |
| 2023 | $2,970 | $356,968 | $93,075 | $263,893 |
| 2022 | $2,706 | $325,998 | $85,000 | $240,998 |
| 2021 | $2,695 | $270,926 | $40,128 | $230,798 |
| 2020 | $2,683 | $250,853 | $37,155 | $213,698 |
| 2019 | $2,487 | $240,625 | $35,640 | $204,985 |
| 2018 | $2,380 | $216,319 | $32,040 | $184,279 |
| 2017 | $2,063 | $206,597 | $30,600 | $175,997 |
| 2016 | $2,293 | $202,546 | $30,000 | $172,546 |
| 2015 | $2,438 | $218,995 | $32,847 | $186,148 |
| 2014 | -- | $228,942 | $34,340 | $194,602 |
| 2013 | -- | $218,683 | $32,980 | $185,703 |
Source: Public Records
Map
Nearby Homes
- 6 Weasel Run Rd
- 2138 Benson Rd
- 0 Deer Rd
- 251 Elizabeth Dr
- 2202 Seabright Loop
- 58 Seabright Loop
- 2045 Apa Rd
- 2242 Seabright Loop
- 103 Goodman Rd
- 0 15 Whalen Dr
- 19 Whalen Dr
- 1940 Apa Rd
- 0 3 73 Acres Derby Ave
- 661 Driftwood Ln
- 1871 Johnson Rd
- 1881 Edwards Dr
- 1928 Sanders Ct Unit 2
- 1774 Centennial Place
- 1 Mill Rd
- 2 Mill Rd
- 2281 Cedar Point Ave
- 2261 Cedar Point Ave
- 2251 Cedar Point Ave
- 2266 Cedar Point Ave
- 2291 Cedar Point Ave
- 2249 Cedar Point Ave
- 2254 Cedar Point Ave
- 0 Cedar Point Ave Unit 365274
- 0 Cedar Point Ave Unit 1005230
- 0 Cedar Point Ave Unit 10440140
- 0 Cedar Point Ave Unit LOT: 7 BLK: 1
- 2243 Cedar Point Ave
- 0 High Bluff Dr Unit 1529014
- 2298 Cedar Point Ave
- 2246 Cedar Point Ave
- 2239 Cedar Point Ave
- 408 High Bluff
- 410 High Bluff Dr
- 404 Debra Dr
- 412 High Bluff Dr
Your Personal Tour Guide
Ask me questions while you tour the home.