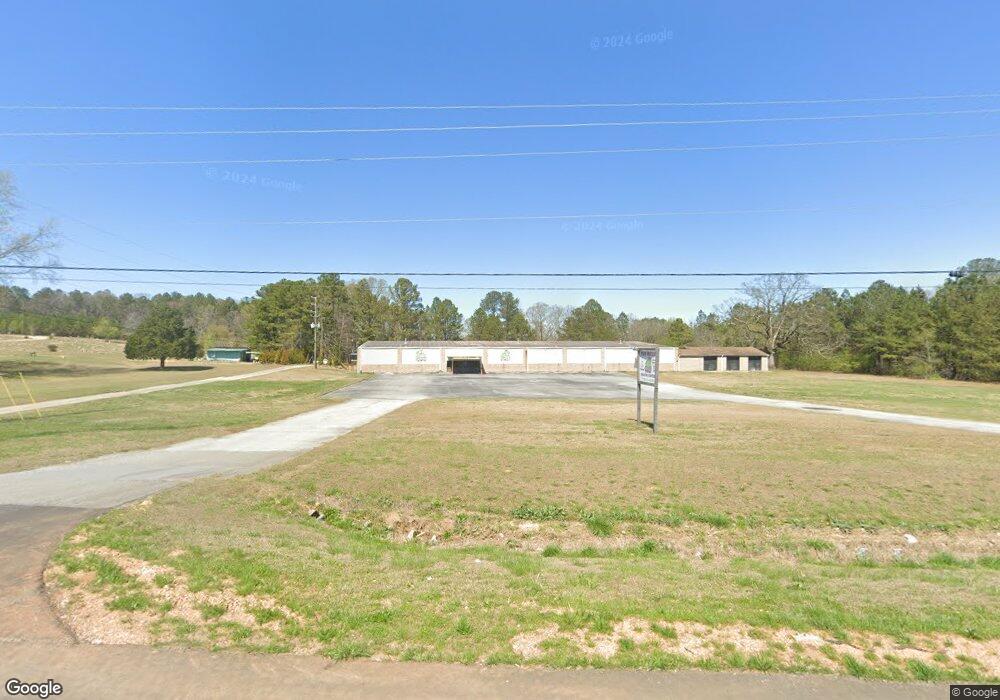
2271 Rockmart Hwy Cedartown, GA 30125
Estimated Value: $418,000 - $548,487
4
Beds
4
Baths
3,932
Sq Ft
$127/Sq Ft
Est. Value
About This Home
This home is located at 2271 Rockmart Hwy, Cedartown, GA 30125 and is currently estimated at $497,622, approximately $126 per square foot. 2271 Rockmart Hwy is a home located in Polk County with nearby schools including Cedar Christian School and Vineyard Harvester Christian Academy.
Ownership History
Date
Name
Owned For
Owner Type
Purchase Details
Closed on
Nov 15, 2019
Sold by
Gray Anna
Bought by
Cleland Chet S
Current Estimated Value
Home Financials for this Owner
Home Financials are based on the most recent Mortgage that was taken out on this home.
Original Mortgage
$167,504
Outstanding Balance
$108,210
Interest Rate
3.6%
Mortgage Type
New Conventional
Estimated Equity
$389,412
Purchase Details
Closed on
May 23, 2008
Sold by
Cleland Chet
Bought by
Cleland Chet and Cleland Gray Anna
Purchase Details
Closed on
May 24, 2001
Sold by
Cleland Sandra S
Bought by
Cleland Chet
Purchase Details
Closed on
Jan 5, 1993
Sold by
Cleland William Henr
Bought by
Cleland Sandra S
Purchase Details
Closed on
Apr 10, 1989
Sold by
Cleland Nelma M
Bought by
Cleland W H
Purchase Details
Closed on
Feb 1, 1976
Bought by
Cleland W H
Create a Home Valuation Report for This Property
The Home Valuation Report is an in-depth analysis detailing your home's value as well as a comparison with similar homes in the area
Home Values in the Area
Average Home Value in this Area
Purchase History
| Date | Buyer | Sale Price | Title Company |
|---|---|---|---|
| Cleland Chet S | -- | -- | |
| Cleland Chet | -- | -- | |
| Cleland Chet | -- | -- | |
| Cleland Sandra S | -- | -- | |
| Cleland W H | -- | -- | |
| Cleland W H | -- | -- |
Source: Public Records
Mortgage History
| Date | Status | Borrower | Loan Amount |
|---|---|---|---|
| Open | Cleland Chet S | $167,504 |
Source: Public Records
Tax History Compared to Growth
Tax History
| Year | Tax Paid | Tax Assessment Tax Assessment Total Assessment is a certain percentage of the fair market value that is determined by local assessors to be the total taxable value of land and additions on the property. | Land | Improvement |
|---|---|---|---|---|
| 2024 | $4,777 | $228,550 | $4,050 | $224,500 |
| 2023 | $3,455 | $145,602 | $4,050 | $141,552 |
| 2022 | $2,933 | $123,568 | $2,700 | $120,868 |
| 2021 | $2,971 | $123,568 | $2,700 | $120,868 |
| 2020 | $2,977 | $123,568 | $2,700 | $120,868 |
| 2019 | $2,557 | $95,212 | $2,700 | $92,512 |
| 2018 | $2,625 | $95,251 | $2,700 | $92,551 |
| 2017 | $2,592 | $95,251 | $2,700 | $92,551 |
| 2016 | $2,580 | $94,813 | $2,928 | $91,885 |
| 2015 | $2,671 | $97,871 | $2,928 | $94,942 |
| 2014 | $2,687 | $97,724 | $2,782 | $94,942 |
Source: Public Records
Map
Nearby Homes
- 200 Kelly Rd
- 387 Lindsey Chapel Rd
- 94 Wimberly Hill Loop
- 256 Cuzzort Rd
- 728 Hutto Rd
- 1522 Collard Valley Rd
- 0 Blanche Rd Unit 10609468
- 0 Blanche Rd Unit 7652978
- 618 Valley Rd
- 660 Valley Rd
- 209 Ridgewood Rd
- 645 Valley Rd
- 202 Ridgewood Rd
- 662 Hillside Dr
- 3323 Rockmart Hwy
- 10 Woodglen Dr
- 12 Breckenridge Dr
- 536 Wimberly Hill Rd
- 0 Coaling Rd Unit 9221-D 10352096
- 0 Coaling Rd Unit 9221-C 10352086
- 8 Rockmart Hwy
- W Rockmart Hwy
- 142 Ledbetter Rd
- 0 Kelly Rd
- 0 Kelly Rd Unit 20165854
- 0 Kelly Rd Unit 8034857
- 2262 Rockmart Hwy
- 56 Kelly Rd
- 2109 Rockmart Hwy
- 308 Lindsey Chapel Rd
- 2425 Rockmart Hwy
- 115 Ledbetter Rd
- 97 Ledbetter Rd
- 64 Ledbetter Rd
- 2069 Rockmart Hwy
- 65 Ledbetter Rd
- 66 Lindsey Chapel Rd
- 2059 Rockmart Hwy
- 95 Ledbetter Rd
- 122 Lindsey Chapel Rd