Estimated Value: $142,453 - $346,000
2
Beds
2
Baths
828
Sq Ft
$257/Sq Ft
Est. Value
About This Home
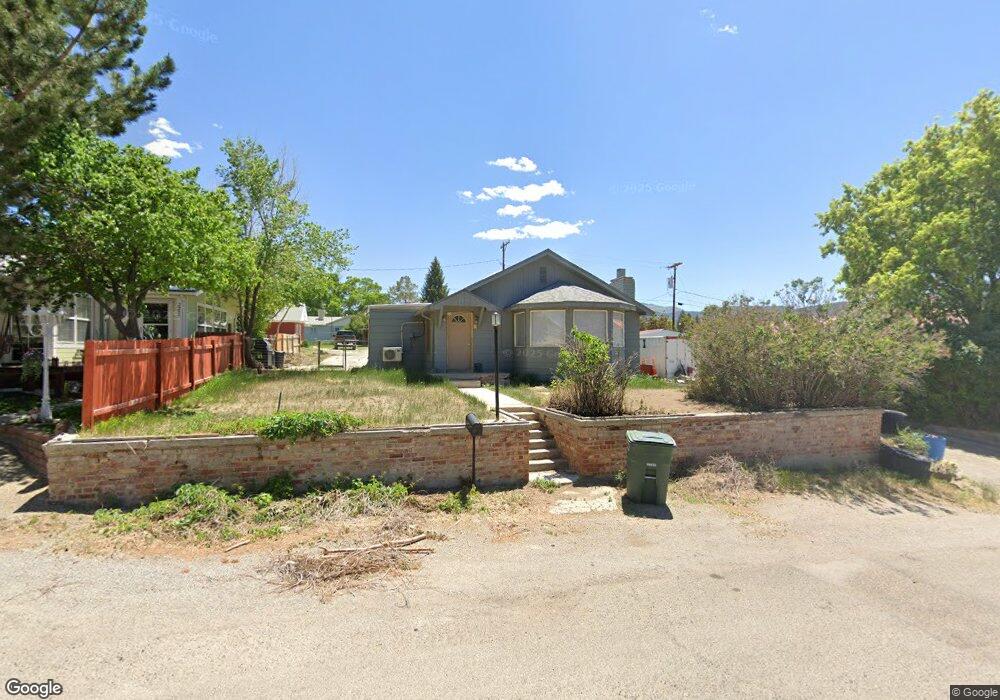
This home is located at 2271 South St, Ely, NV 89301 and is currently estimated at $212,613, approximately $256 per square foot. 2271 South St is a home located in White Pine County with nearby schools including David E. Norman Elementary School, White Pine Middle School, and White Pine High School.
Ownership History
Date
Name
Owned For
Owner Type
Purchase Details
Closed on
Sep 24, 2025
Sold by
Kelly Nathan and Kelly Kezia
Bought by
2271 South Llc
Current Estimated Value
Purchase Details
Closed on
Sep 3, 2024
Sold by
Nicholes Joshua C and Nicholes Joshua C
Bought by
Kelly Nathan
Home Financials for this Owner
Home Financials are based on the most recent Mortgage that was taken out on this home.
Original Mortgage
$150,000
Interest Rate
10%
Mortgage Type
New Conventional
Purchase Details
Closed on
Aug 30, 2024
Sold by
Kelly Kezia M and Kelly Nathan
Bought by
Kelly Nathan
Home Financials for this Owner
Home Financials are based on the most recent Mortgage that was taken out on this home.
Original Mortgage
$150,000
Interest Rate
10%
Mortgage Type
New Conventional
Purchase Details
Closed on
Oct 13, 2006
Sold by
Carney Kenneth L
Bought by
Nicholes Joshua C
Purchase Details
Closed on
Sep 25, 2006
Sold by
Carney Kenneth L
Bought by
Nicholes Joshua
Create a Home Valuation Report for This Property
The Home Valuation Report is an in-depth analysis detailing your home's value as well as a comparison with similar homes in the area
Home Values in the Area
Average Home Value in this Area
Purchase History
| Date | Buyer | Sale Price | Title Company |
|---|---|---|---|
| 2271 South Llc | -- | None Listed On Document | |
| Kelly Nathan | -- | None Listed On Document | |
| Kelly Nathan | $65,000 | Stewart Title | |
| Kelly Nathan | $65,000 | Stewart Title | |
| Nicholes Joshua C | $65,000 | Stewart Title | |
| Kelly Nathan | $65,000 | Stewart Title | |
| Kelly Nathan | $65,000 | Stewart Title | |
| Nicholes Joshua C | $23,880 | -- | |
| Nicholes Joshua | -- | -- |
Source: Public Records
Mortgage History
| Date | Status | Borrower | Loan Amount |
|---|---|---|---|
| Previous Owner | Kelly Nathan | $150,000 |
Source: Public Records
Tax History
| Year | Tax Paid | Tax Assessment Tax Assessment Total Assessment is a certain percentage of the fair market value that is determined by local assessors to be the total taxable value of land and additions on the property. | Land | Improvement |
|---|---|---|---|---|
| 2025 | -- | $20,096 | $3,028 | $17,068 |
| 2024 | -- | $17,404 | $2,713 | $14,691 |
| 2023 | $426 | $15,808 | $2,713 | $13,095 |
| 2022 | $536 | $13,672 | $2,153 | $11,519 |
| 2021 | $506 | $12,839 | $2,153 | $10,686 |
| 2020 | $510 | $13,131 | $2,153 | $10,978 |
| 2019 | $496 | $12,657 | $2,153 | $10,504 |
| 2018 | $483 | $12,419 | $2,363 | $10,056 |
| 2017 | $388 | $9,917 | $2,153 | $7,764 |
| 2016 | $378 | $9,275 | $2,153 | $7,122 |
| 2015 | $338 | $9,204 | $2,153 | $7,051 |
| 2014 | $338 | $9,468 | $2,555 | $6,913 |
Source: Public Records
Map
Nearby Homes
Your Personal Tour Guide
Ask me questions while you tour the home.