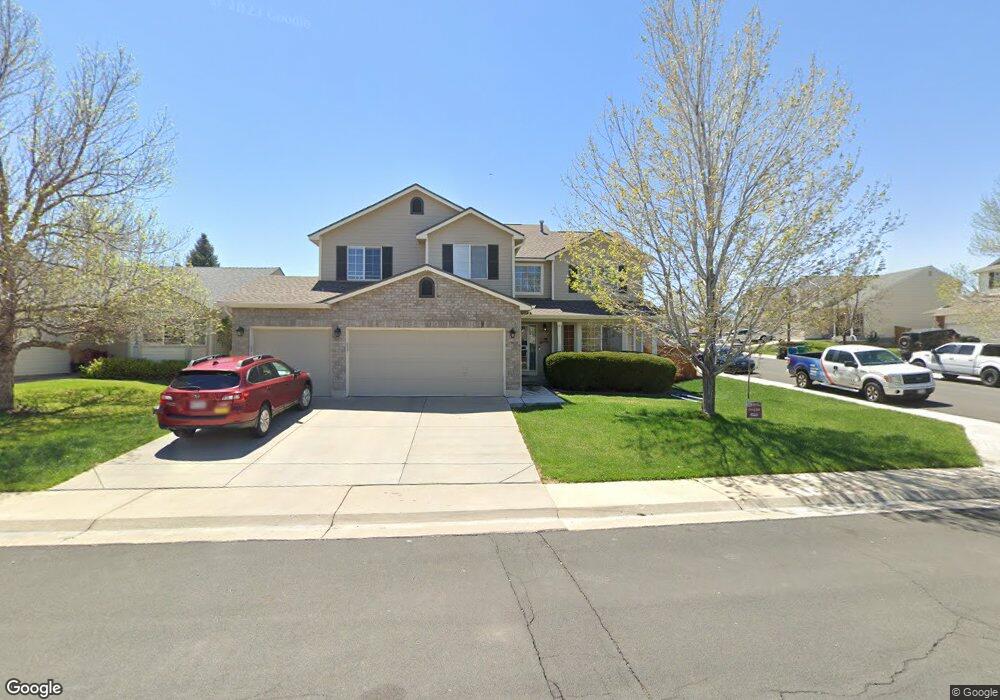
22710 E Prentice Place Aurora, CO 80015
Saddle Rock Ridge NeighborhoodEstimated Value: $593,000 - $650,000
4
Beds
3
Baths
3,595
Sq Ft
$172/Sq Ft
Est. Value
About This Home
This home is located at 22710 E Prentice Place, Aurora, CO 80015 and is currently estimated at $619,854, approximately $172 per square foot. 22710 E Prentice Place is a home located in Arapahoe County with nearby schools including Antelope Ridge Elementary School, Thunder Ridge Middle School, and Eaglecrest High School.
Ownership History
Date
Name
Owned For
Owner Type
Purchase Details
Closed on
Nov 20, 2015
Sold by
Lynch Curtis R and Lynch Suzanne M
Bought by
Pietroboni Jerry P and Pietroboni Marie C
Current Estimated Value
Home Financials for this Owner
Home Financials are based on the most recent Mortgage that was taken out on this home.
Original Mortgage
$316,000
Outstanding Balance
$246,572
Interest Rate
3.8%
Mortgage Type
New Conventional
Estimated Equity
$373,282
Purchase Details
Closed on
Nov 10, 2000
Sold by
Melody Homes Inc
Bought by
Lynch Curtis R and Lynch Suzanne M
Home Financials for this Owner
Home Financials are based on the most recent Mortgage that was taken out on this home.
Original Mortgage
$140,000
Interest Rate
7.9%
Create a Home Valuation Report for This Property
The Home Valuation Report is an in-depth analysis detailing your home's value as well as a comparison with similar homes in the area
Home Values in the Area
Average Home Value in this Area
Purchase History
| Date | Buyer | Sale Price | Title Company |
|---|---|---|---|
| Pietroboni Jerry P | $395,000 | Fidelity National Title Ins | |
| Lynch Curtis R | $256,780 | Land Title |
Source: Public Records
Mortgage History
| Date | Status | Borrower | Loan Amount |
|---|---|---|---|
| Open | Pietroboni Jerry P | $316,000 | |
| Previous Owner | Lynch Curtis R | $140,000 |
Source: Public Records
Tax History
| Year | Tax Paid | Tax Assessment Tax Assessment Total Assessment is a certain percentage of the fair market value that is determined by local assessors to be the total taxable value of land and additions on the property. | Land | Improvement |
|---|---|---|---|---|
| 2025 | $4,670 | $41,013 | -- | -- |
| 2024 | $4,196 | $40,528 | -- | -- |
| 2023 | $4,196 | $40,528 | $0 | $0 |
| 2022 | $3,745 | $32,360 | $0 | $0 |
| 2021 | $3,773 | $32,360 | $0 | $0 |
| 2020 | $3,862 | $0 | $0 | $0 |
| 2019 | $3,747 | $33,884 | $0 | $0 |
| 2018 | $3,655 | $30,046 | $0 | $0 |
| 2017 | $3,603 | $30,046 | $0 | $0 |
| 2016 | $3,134 | $24,891 | $0 | $0 |
| 2015 | $3,040 | $24,891 | $0 | $0 |
| 2014 | -- | $20,298 | $0 | $0 |
| 2013 | -- | $21,180 | $0 | $0 |
Source: Public Records
Map
Nearby Homes
- 5361 S Ukraine Way
- 22894 E Progress Ave
- 5450 S Valdai St
- 22501 E Belleview Place
- 5453 S Sicily St
- 22286 E Belleview Ln
- 5593 S Valdai Way
- 5435 S Shawnee Way
- 5466 S Shawnee Way
- 5555 S Rome St
- 5604 S Yakima Way
- 5414 S Rome St
- 23404 E Dorado Place
- 5633 S Sicily Cir
- 5644 S Zante Cir
- 22156 E Berry Place
- 23424 E Dorado Place Unit A
- 23413 E Dorado Place Unit A
- 5014 S Shawnee St
- 22341 E Dorado Dr
- 22730 E Prentice Place
- 5393 S Valdai Way
- 22750 E Prentice Place
- 5329 S Valdai St
- 5391 S Valdai Way
- 5327 S Valdai St
- 5331 S Valdai St
- 5325 S Valdai St
- 22719 E Prentice Place
- 5389 S Valdai Way
- 5333 S Valdai St
- 5323 S Valdai St
- 22780 E Prentice Place
- 22759 E Prentice Place
- 5321 S Valdai St
- 5387 S Valdai Way
- 5328 S Ukraine St
- 5330 S Ukraine St
- 5326 S Ukraine St
- 22789 E Prentice Place
Your Personal Tour Guide
Ask me questions while you tour the home.