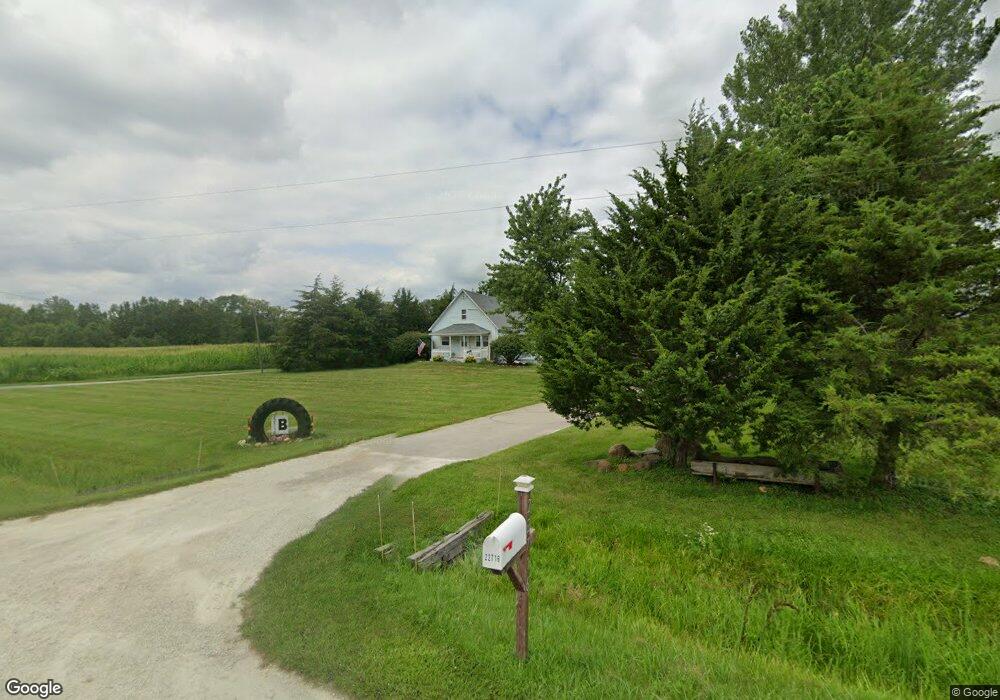
22716 W County Line Rd Custer Park, IL 60481
Estimated Value: $166,873 - $327,000
3
Beds
1
Bath
2,100
Sq Ft
$123/Sq Ft
Est. Value
About This Home
This home is located at 22716 W County Line Rd, Custer Park, IL 60481 and is currently estimated at $257,718, approximately $122 per square foot. 22716 W County Line Rd is a home located in Will County with nearby schools including Reed-Custer Intermediate School, Reed-Custer Middle School, and Reed-Custer High School.
Ownership History
Date
Name
Owned For
Owner Type
Purchase Details
Closed on
Jul 29, 2017
Sold by
Bollinger Mark
Bought by
Brodinski Joseph and Brodinski Andrea
Current Estimated Value
Home Financials for this Owner
Home Financials are based on the most recent Mortgage that was taken out on this home.
Original Mortgage
$175,925
Interest Rate
3.87%
Mortgage Type
FHA
Purchase Details
Closed on
Sep 23, 1997
Sold by
Collins Herbert L and Collins Lillian
Bought by
Bollinger Mark A and Bollinger Dana L
Home Financials for this Owner
Home Financials are based on the most recent Mortgage that was taken out on this home.
Original Mortgage
$83,250
Interest Rate
7.63%
Mortgage Type
FHA
Purchase Details
Closed on
Jul 14, 1997
Sold by
Collins Thomas V
Bought by
Collins Herbert L and Collins Lillian M
Create a Home Valuation Report for This Property
The Home Valuation Report is an in-depth analysis detailing your home's value as well as a comparison with similar homes in the area
Home Values in the Area
Average Home Value in this Area
Purchase History
| Date | Buyer | Sale Price | Title Company |
|---|---|---|---|
| Brodinski Joseph | $182,000 | Citywide Title Corporation | |
| Bollinger Mark A | $84,000 | -- | |
| Collins Herbert L | -- | -- |
Source: Public Records
Mortgage History
| Date | Status | Borrower | Loan Amount |
|---|---|---|---|
| Previous Owner | Brodinski Joseph | $175,925 | |
| Previous Owner | Bollinger Mark A | $83,250 |
Source: Public Records
Tax History Compared to Growth
Tax History
| Year | Tax Paid | Tax Assessment Tax Assessment Total Assessment is a certain percentage of the fair market value that is determined by local assessors to be the total taxable value of land and additions on the property. | Land | Improvement |
|---|---|---|---|---|
| 2024 | $1,894 | $39,473 | $10,275 | $29,198 |
| 2023 | $1,894 | $36,719 | $9,558 | $27,161 |
| 2022 | $1,799 | $34,844 | $9,070 | $25,774 |
| 2021 | $1,776 | $34,194 | $8,901 | $25,293 |
| 2020 | $1,781 | $34,194 | $8,901 | $25,293 |
| 2019 | $1,755 | $33,940 | $8,835 | $25,105 |
| 2018 | $1,634 | $31,720 | $8,257 | $23,463 |
| 2017 | $1,513 | $29,648 | $7,718 | $21,930 |
| 2016 | $1,448 | $28,323 | $7,373 | $20,950 |
| 2015 | $1,269 | $26,923 | $7,009 | $19,914 |
| 2014 | $1,269 | $26,315 | $6,851 | $19,464 |
| 2013 | $1,269 | $26,779 | $6,972 | $19,807 |
Source: Public Records
Map
Nearby Homes
- 113 Prairie Dr
- 245 Essex Way
- 110 Fairway Dr
- 120 Fairway Dr
- 130 Fairway Dr
- 125 Fairway Dr
- 135 Fairway Dr
- 210 Essex Way
- 211 Norfolk Way
- 4870 N 16000w Rd
- 34769 Zilm Rd
- 22954 Mcguire Rd
- 128 North St
- 310 Fairway Dr
- LOT 25 N 16000w Rd
- 0 W North St Unit 8237067
- 111 E Main St
- 109 Foley Dr
- 217 N Parls St
- 4780 N 16000n Rd
- 22716 W County Line Rd
- 22632 W County Line Rd
- 22444 W County Line Rd
- 22444 W County Line Rd
- 22748 W County Line Rd
- 14548 W 6000n Rd
- 5967 N 14750w Rd
- 37344 Zilm Rd
- 1110 County Line Rd
- 37258 S Zilm Rd
- 37158 Zilm Rd
- 37325 S Zilm Rd
- 37124 S Zilm Rd
- 37212 Zilm Rd
- 37236 Zilm Rd
- Vacant#11 County Line Rd
- VACANT#8 County Line Rd
- VACANT#13 County Line Rd
- VACANT9 County Line Rd
- VACANT 14 County Line Rd