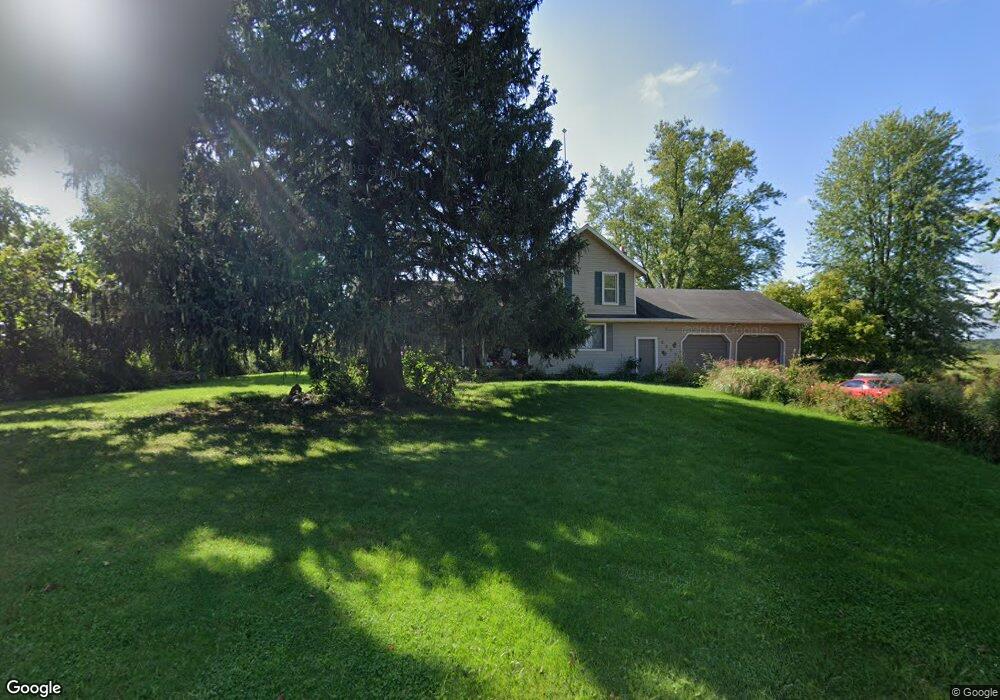
2272 114th Ave Allegan, MI 49010
Estimated Value: $711,000 - $1,133,299
4
Beds
1
Bath
2,117
Sq Ft
$436/Sq Ft
Est. Value
About This Home
This home is located at 2272 114th Ave, Allegan, MI 49010 and is currently estimated at $922,150, approximately $435 per square foot. 2272 114th Ave is a home located in Allegan County with nearby schools including Pine Trails Elementary School, L.E. White Middle School, and Allegan High School.
Ownership History
Date
Name
Owned For
Owner Type
Purchase Details
Closed on
Jun 2, 2006
Sold by
Davenport Terry and Davenport Judy Marie
Bought by
Fox Douglas L
Current Estimated Value
Home Financials for this Owner
Home Financials are based on the most recent Mortgage that was taken out on this home.
Original Mortgage
$163,000
Outstanding Balance
$96,312
Interest Rate
6.66%
Mortgage Type
Unknown
Estimated Equity
$825,838
Create a Home Valuation Report for This Property
The Home Valuation Report is an in-depth analysis detailing your home's value as well as a comparison with similar homes in the area
Home Values in the Area
Average Home Value in this Area
Purchase History
| Date | Buyer | Sale Price | Title Company |
|---|---|---|---|
| Fox Douglas L | $395,000 | Devon Title Agency |
Source: Public Records
Mortgage History
| Date | Status | Borrower | Loan Amount |
|---|---|---|---|
| Open | Fox Douglas L | $163,000 | |
| Closed | Fox Douglas L | $35,000 |
Source: Public Records
Tax History Compared to Growth
Tax History
| Year | Tax Paid | Tax Assessment Tax Assessment Total Assessment is a certain percentage of the fair market value that is determined by local assessors to be the total taxable value of land and additions on the property. | Land | Improvement |
|---|---|---|---|---|
| 2025 | $3,361 | $427,000 | $309,300 | $117,700 |
| 2024 | $3,046 | $361,400 | $251,500 | $109,900 |
| 2023 | $3,046 | $339,900 | $243,900 | $96,000 |
| 2022 | $3,046 | $295,900 | $221,400 | $74,500 |
| 2021 | $2,866 | $281,800 | $221,400 | $60,400 |
| 2020 | $2,866 | $273,500 | $221,400 | $52,100 |
| 2019 | $2,730 | $259,600 | $220,900 | $38,700 |
| 2018 | $0 | $257,000 | $221,700 | $35,300 |
| 2017 | $0 | $269,500 | $231,700 | $37,800 |
| 2016 | $0 | $269,500 | $231,700 | $37,800 |
| 2015 | -- | $269,500 | $231,700 | $37,800 |
| 2014 | -- | $256,100 | $219,000 | $37,100 |
| 2013 | -- | $219,600 | $182,500 | $37,100 |
Source: Public Records
Map
Nearby Homes