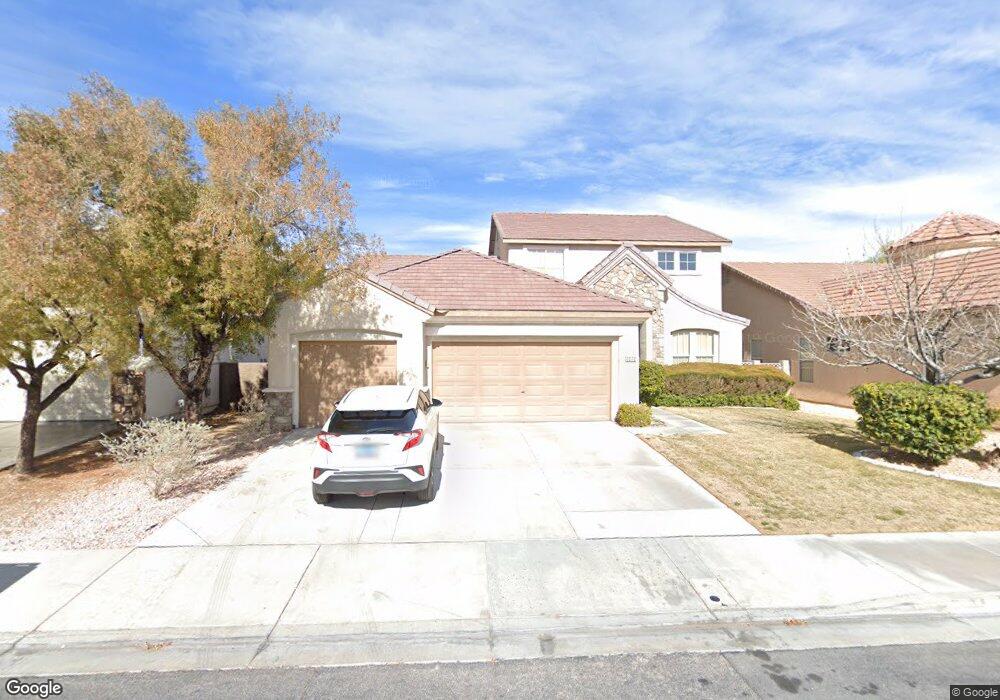
2272 Moresca Ave Henderson, NV 89052
Anthem Country Club NeighborhoodEstimated Value: $691,784 - $817,000
4
Beds
3
Baths
2,966
Sq Ft
$253/Sq Ft
Est. Value
About This Home
This home is located at 2272 Moresca Ave, Henderson, NV 89052 and is currently estimated at $751,196, approximately $253 per square foot. 2272 Moresca Ave is a home located in Clark County with nearby schools including Frank S Lamping Elementary School, Del E. Webb Middle School, and Coronado High School.
Ownership History
Date
Name
Owned For
Owner Type
Purchase Details
Closed on
Aug 7, 2023
Sold by
Delacruz Marcelo P and Delacruz Divinia
Bought by
Delacruz Marcelo P & Divinia Joint Living Tru and Delacruz
Current Estimated Value
Purchase Details
Closed on
Jan 6, 2020
Sold by
Delacruz Marcelo P and Delacruz Divinia
Bought by
Cruz Marcelo P De La and Delacruz Divinia
Home Financials for this Owner
Home Financials are based on the most recent Mortgage that was taken out on this home.
Original Mortgage
$103,000
Interest Rate
3.6%
Mortgage Type
New Conventional
Purchase Details
Closed on
Nov 5, 2004
Sold by
Delacruz Divinia and Delacruz Marcelo P
Bought by
Moresca Holdings Lp
Purchase Details
Closed on
Jul 6, 2000
Sold by
Richmond American Homes Of Nevada Inc
Bought by
Delacruz Divinia and Delacruz Marcelo P
Home Financials for this Owner
Home Financials are based on the most recent Mortgage that was taken out on this home.
Original Mortgage
$180,000
Interest Rate
7.11%
Create a Home Valuation Report for This Property
The Home Valuation Report is an in-depth analysis detailing your home's value as well as a comparison with similar homes in the area
Home Values in the Area
Average Home Value in this Area
Purchase History
| Date | Buyer | Sale Price | Title Company |
|---|---|---|---|
| Delacruz Marcelo P & Divinia Joint Living Tru | -- | None Listed On Document | |
| Cruz Marcelo P De La | -- | Ticor Title Green Valley | |
| Delacruz Marcelo P | -- | Ticor Title Green Valley | |
| Moresca Holdings Lp | -- | -- | |
| Delacruz Family Trust | -- | -- | |
| Delacruz Divinia | $252,261 | Old Republic Title Company |
Source: Public Records
Mortgage History
| Date | Status | Borrower | Loan Amount |
|---|---|---|---|
| Previous Owner | Cruz Marcelo P De La | $103,000 | |
| Previous Owner | Delacruz Divinia | $180,000 |
Source: Public Records
Tax History Compared to Growth
Tax History
| Year | Tax Paid | Tax Assessment Tax Assessment Total Assessment is a certain percentage of the fair market value that is determined by local assessors to be the total taxable value of land and additions on the property. | Land | Improvement |
|---|---|---|---|---|
| 2025 | $2,868 | $172,909 | $66,150 | $106,759 |
| 2024 | $3,158 | $172,909 | $66,150 | $106,759 |
| 2023 | $2,547 | $161,584 | $60,550 | $101,034 |
| 2022 | $3,441 | $136,615 | $44,450 | $92,165 |
| 2021 | $3,186 | $131,436 | $43,750 | $87,686 |
| 2020 | $2,956 | $127,194 | $40,250 | $86,944 |
| 2019 | $2,770 | $120,719 | $35,000 | $85,719 |
| 2018 | $2,689 | $112,053 | $30,100 | $81,953 |
| 2017 | $3,281 | $113,200 | $30,100 | $83,100 |
| 2016 | $2,547 | $97,078 | $14,000 | $83,078 |
| 2015 | $2,541 | $88,541 | $14,000 | $74,541 |
| 2014 | $2,467 | $82,641 | $12,250 | $70,391 |
Source: Public Records
Map
Nearby Homes
- 2279 Pacini Ct
- 2285 Moresca Ave
- 2288 Tedesca Dr Unit 4
- 2251 Tedesca Dr
- 2200 Tedesca Dr
- 2378 Falsetto Ave
- 3 Isleworth Dr
- 1350 Rossini St
- 9 Contra Costa Place
- 2383 Rainswept Ave
- 9 Ibis Ct
- 29 Desert Highlands Dr
- 2150 Ponticello Dr
- 71 Fountainhead Cir
- 67 Fountainhead Cir
- 2420 Taragato Ave
- 77 Fountainhead Cir
- 2 El Macero Ct
- 2280 Bull Lake Dr
- 2504 Libretto Ave
- 2270 Moresca Ave
- 2274 Moresca Ave
- 2273 Pacini Ct
- 2271 Pacini Ct
- 2268 Moresca Ave
- 2276 Moresca Ave
- 2275 Pacini Ct
- 2269 Pacini Ct
- 2273 Moresca Ave
- 2275 Moresca Ave
- 2271 Moresca Ave
- 2277 Pacini Ct
- 2266 Moresca Ave Unit 4
- 2278 Moresca Ave
- 2267 Pacini Ct
- 2277 Moresca Ave
- 2269 Moresca Ave Unit 2012
- 2279 Moresca Ave
- 2280 Moresca Ave Unit non
- 2280 Moresca Ave