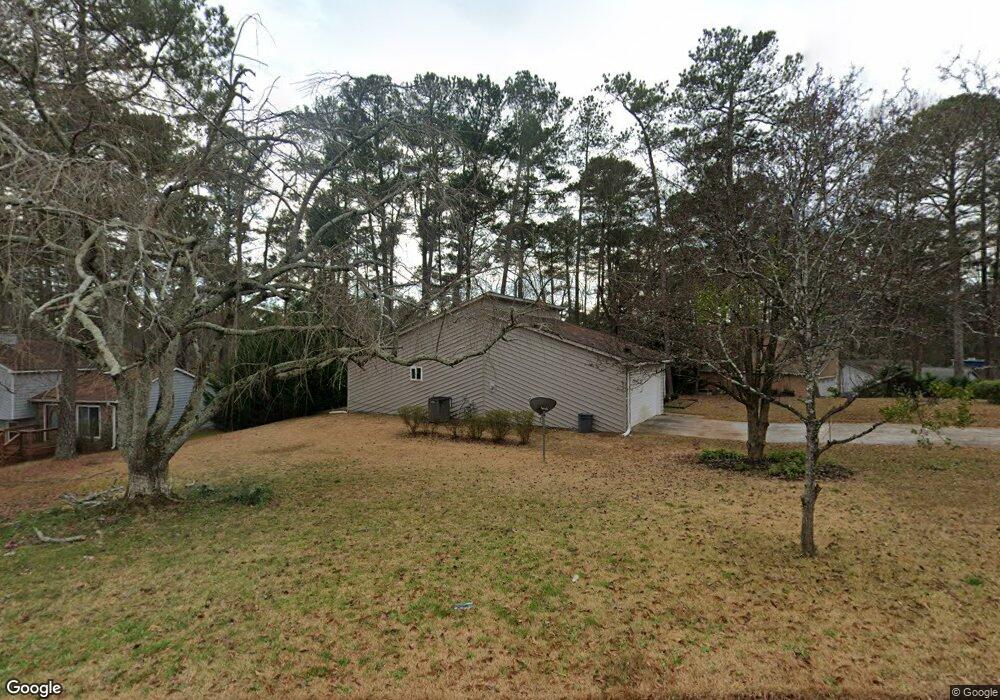
2272 New Castle Cir Norcross, GA 30071
Estimated Value: $327,284 - $353,000
3
Beds
2
Baths
1,535
Sq Ft
$221/Sq Ft
Est. Value
About This Home
This home is located at 2272 New Castle Cir, Norcross, GA 30071 and is currently estimated at $338,571, approximately $220 per square foot. 2272 New Castle Cir is a home located in Gwinnett County with nearby schools including Norcross Elementary School, Summerour Middle School, and Norcross High School.
Ownership History
Date
Name
Owned For
Owner Type
Purchase Details
Closed on
Dec 10, 2021
Sold by
Capview Residential Income Fund Vii Llc
Bought by
Cri Home 1 Llc
Current Estimated Value
Home Financials for this Owner
Home Financials are based on the most recent Mortgage that was taken out on this home.
Original Mortgage
$1,462,180
Outstanding Balance
$335,525
Interest Rate
2.98%
Mortgage Type
Commercial
Estimated Equity
$3,046
Purchase Details
Closed on
Jun 24, 2021
Sold by
Rodier Valentina Gribkova
Bought by
Capview Residential Income Fund Vii Llc
Purchase Details
Closed on
Mar 16, 2001
Sold by
Rodier Rosaire B
Bought by
Rodier Rosaire B and Rodier Valentina G
Home Financials for this Owner
Home Financials are based on the most recent Mortgage that was taken out on this home.
Original Mortgage
$70,000
Interest Rate
6.6%
Mortgage Type
New Conventional
Purchase Details
Closed on
Aug 21, 1996
Sold by
Goodman John V Jose
Bought by
Rodier Rosarie B
Create a Home Valuation Report for This Property
The Home Valuation Report is an in-depth analysis detailing your home's value as well as a comparison with similar homes in the area
Home Values in the Area
Average Home Value in this Area
Purchase History
| Date | Buyer | Sale Price | Title Company |
|---|---|---|---|
| Cri Home 1 Llc | -- | -- | |
| Capview Residential Income Fund Vii Llc | $227,900 | -- | |
| Rodier Rosaire B | -- | -- | |
| Rodier Rosarie B | $87,000 | -- |
Source: Public Records
Mortgage History
| Date | Status | Borrower | Loan Amount |
|---|---|---|---|
| Open | Cri Home 1 Llc | $1,462,180 | |
| Previous Owner | Rodier Rosaire B | $70,000 | |
| Closed | Rodier Rosarie B | $0 |
Source: Public Records
Tax History Compared to Growth
Tax History
| Year | Tax Paid | Tax Assessment Tax Assessment Total Assessment is a certain percentage of the fair market value that is determined by local assessors to be the total taxable value of land and additions on the property. | Land | Improvement |
|---|---|---|---|---|
| 2025 | $4,473 | $141,560 | $25,840 | $115,720 |
| 2024 | $4,019 | $125,600 | $21,600 | $104,000 |
| 2023 | $4,019 | $133,800 | $21,600 | $112,200 |
| 2022 | $2,926 | $91,160 | $21,600 | $69,560 |
| 2021 | $264 | $81,080 | $14,840 | $66,240 |
| 2020 | $264 | $81,080 | $14,840 | $66,240 |
| 2019 | $261 | $76,400 | $14,000 | $62,400 |
| 2018 | $261 | $59,600 | $10,000 | $49,600 |
| 2016 | $261 | $55,000 | $10,000 | $45,000 |
| 2015 | $270 | $38,000 | $8,000 | $30,000 |
| 2014 | $274 | $38,000 | $8,000 | $30,000 |
Source: Public Records
Map
Nearby Homes
- 2199 Summertown Dr
- 5477 Windy Creek Ln
- 5479 Windy Creek Ln
- 2375 Beaver Falls Dr
- 5364 Hickory Knoll
- 5358 Beaver Branch
- 5357 Beaver Branch
- 26 Reeves St
- 5341 Goodwick Way
- 5639 Chatham Cir
- 5457 Rails Way
- 2340 Beaver Ruin Rd Unit 26
- 2340 Beaver Ruin Rd Unit 41
- 2340 Beaver Ruin Rd
- 2340 Beaver Ruin Rd Unit 15
- 2340 Beaver Ruin Rd Unit 16
- 5381 Station Cir Unit 3
- 2472 Westhill Ct NW
- 2472 Westhill Ct
- 2848 Wild Laurel Ct
- 5464 Doncaster Ct
- 2262 New Castle Cir Unit 1
- 5474 Doncaster Ct Unit 1
- 2252 New Castle Cir Unit 1
- 2273 New Castle Cir Unit 1
- 2263 New Castle Cir
- 2292 New Castle Cir
- 2249 Summertown Dr Unit 3
- 2239 Summertown Dr Unit 3
- 2283 New Castle Cir Unit 1
- 2253 New Castle Cir Unit 1
- 2242 New Castle Cir
- 2259 Summertown Dr
- 2302 New Castle Cir Unit 1
- 2293 New Castle Cir
- 2269 Summertown Dr Unit 3
- 2229 Summertown Dr
- 5494 Doncaster Ct
- 2243 New Castle Cir
- 2272 Huddersfield Way Unit 1