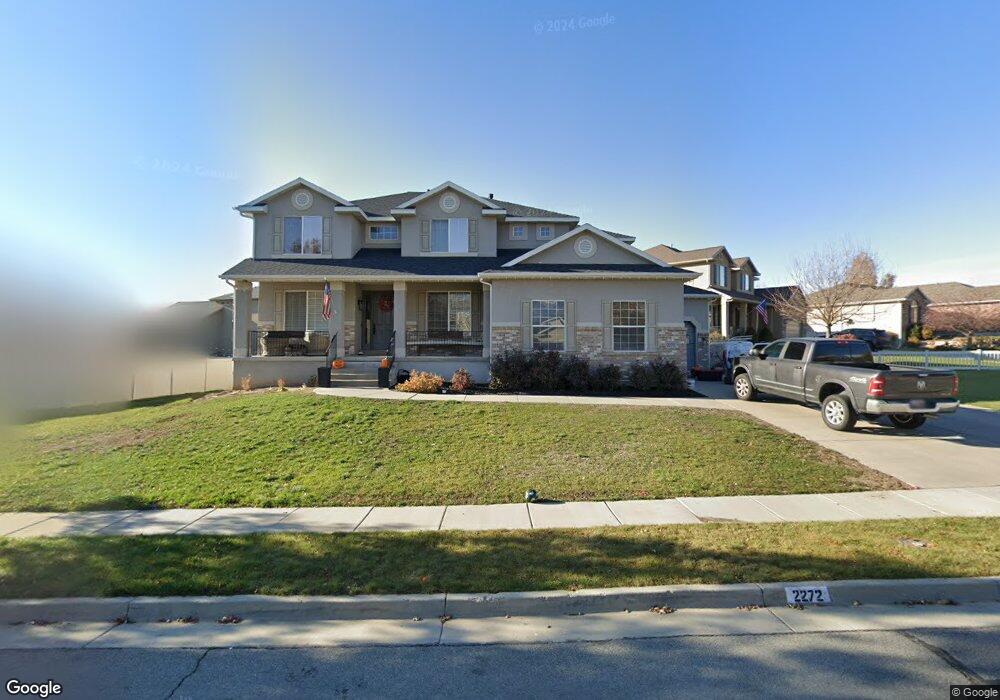
2272 S 200 E Kaysville, UT 84037
West Kaysville NeighborhoodEstimated Value: $835,000 - $926,000
6
Beds
3
Baths
4,771
Sq Ft
$186/Sq Ft
Est. Value
About This Home
This home is located at 2272 S 200 E, Kaysville, UT 84037 and is currently estimated at $886,946, approximately $185 per square foot. 2272 S 200 E is a home located in Davis County with nearby schools including Endeavour Elementary School, Farmington High, and Centennial Junior High School.
Ownership History
Date
Name
Owned For
Owner Type
Purchase Details
Closed on
Jul 21, 2017
Sold by
Smith Cynthia
Bought by
Andrus Joel
Current Estimated Value
Home Financials for this Owner
Home Financials are based on the most recent Mortgage that was taken out on this home.
Original Mortgage
$381,000
Outstanding Balance
$316,547
Interest Rate
3.89%
Mortgage Type
New Conventional
Estimated Equity
$570,399
Purchase Details
Closed on
Jul 11, 2005
Sold by
Woodside Quail Crossing Llc
Bought by
Smith Cynthia and Kelley John C
Home Financials for this Owner
Home Financials are based on the most recent Mortgage that was taken out on this home.
Original Mortgage
$261,050
Interest Rate
6.37%
Mortgage Type
Fannie Mae Freddie Mac
Purchase Details
Closed on
Oct 21, 2004
Sold by
Danville Land Investments Llc
Bought by
Corporation Of The Presiding Bishop Of T
Create a Home Valuation Report for This Property
The Home Valuation Report is an in-depth analysis detailing your home's value as well as a comparison with similar homes in the area
Home Values in the Area
Average Home Value in this Area
Purchase History
| Date | Buyer | Sale Price | Title Company |
|---|---|---|---|
| Andrus Joel | -- | Pinnacle Title | |
| Smith Cynthia | -- | Pinnacle Title | |
| Smith Cynthia | -- | Us Title Company Of Utah | |
| Corporation Of The Presiding Bishop Of T | -- | First American Title |
Source: Public Records
Mortgage History
| Date | Status | Borrower | Loan Amount |
|---|---|---|---|
| Open | Andrus Joel | $381,000 | |
| Previous Owner | Smith Cynthia | $48,950 | |
| Previous Owner | Smith Cynthia | $261,050 |
Source: Public Records
Tax History Compared to Growth
Tax History
| Year | Tax Paid | Tax Assessment Tax Assessment Total Assessment is a certain percentage of the fair market value that is determined by local assessors to be the total taxable value of land and additions on the property. | Land | Improvement |
|---|---|---|---|---|
| 2024 | $4,080 | $417,450 | $162,984 | $254,466 |
| 2023 | $4,175 | $756,000 | $302,487 | $453,513 |
| 2022 | $4,253 | $435,600 | $165,982 | $269,618 |
| 2021 | $3,796 | $582,000 | $185,363 | $396,637 |
| 2020 | $3,431 | $511,000 | $156,365 | $354,635 |
| 2019 | $3,364 | $492,000 | $165,555 | $326,445 |
| 2018 | $3,160 | $460,000 | $136,425 | $323,575 |
| 2016 | $2,724 | $207,625 | $57,823 | $149,802 |
| 2015 | $2,945 | $213,125 | $57,823 | $155,302 |
| 2014 | $3,149 | $231,965 | $57,829 | $174,136 |
| 2013 | -- | $186,980 | $50,368 | $136,612 |
Source: Public Records
Map
Nearby Homes
- 276 E 2200 S
- 1566 W Pheasant Place
- 2261 S 50 E
- 2274 S 50 E
- 278 E Shepard Ln
- 926 N 1875 W
- 2071 S 400 E
- 69 W 2200 S
- 2266 S Betsys Way
- 2226 S Betsys Way
- 1820 S Kerrybrook Dr
- 556 Innovator Dr Unit 158
- 1332 N 1580 W
- 1181 Set Ct Unit 2
- 87 Baer Creek Dr
- 419 E 1700 S
- 1356 Fairway Cir
- 604 Sego Way Unit 220
- 604 Sego Way Unit 207
- 1488 W Kiera Ct Unit 148