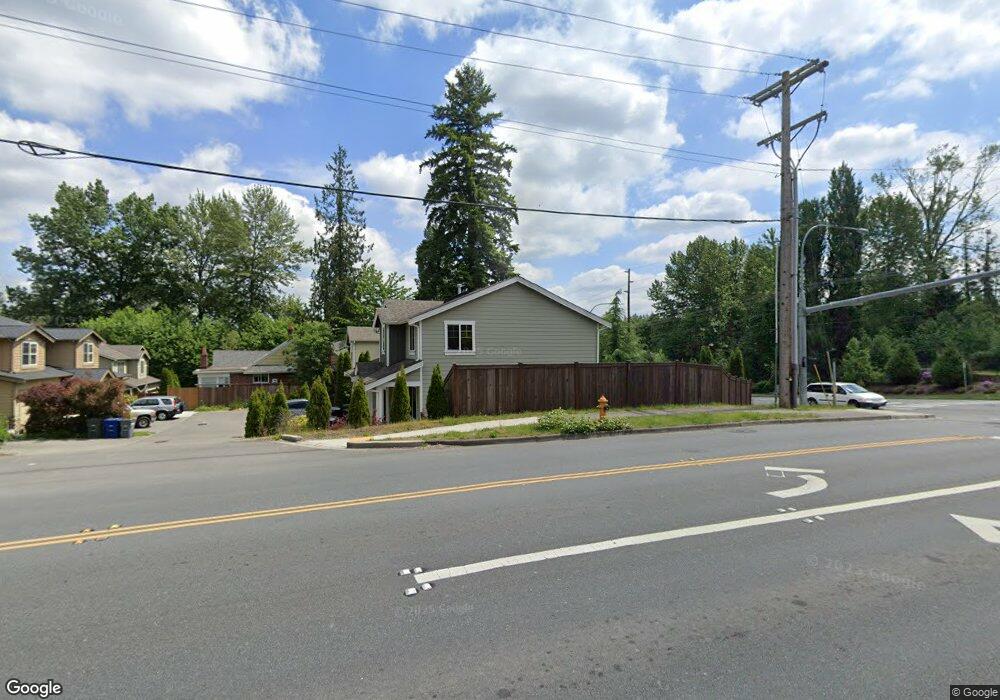
22727 9th Ave SE Bothell, WA 98021
Queensborough-Brentwood NeighborhoodEstimated Value: $865,245 - $1,236,000
4
Beds
3
Baths
2,095
Sq Ft
$480/Sq Ft
Est. Value
About This Home
This home is located at 22727 9th Ave SE, Bothell, WA 98021 and is currently estimated at $1,004,811, approximately $479 per square foot. 22727 9th Ave SE is a home located in Snohomish County with nearby schools including Shelton View Elementary School, Canyon Park Junior High School, and Bothell High School.
Ownership History
Date
Name
Owned For
Owner Type
Purchase Details
Closed on
Jul 28, 2010
Sold by
Fannie Mae
Bought by
Sunner Sukhwinder S and Kalirai Mandeep K
Current Estimated Value
Home Financials for this Owner
Home Financials are based on the most recent Mortgage that was taken out on this home.
Original Mortgage
$315,748
Outstanding Balance
$192,406
Interest Rate
3.5%
Mortgage Type
FHA
Estimated Equity
$812,405
Purchase Details
Closed on
Mar 19, 2010
Sold by
Murray Scott M
Bought by
Federal National Mortgage Association
Purchase Details
Closed on
Aug 1, 2006
Sold by
Scharbach Construction Llc
Bought by
Murray Scott M
Home Financials for this Owner
Home Financials are based on the most recent Mortgage that was taken out on this home.
Original Mortgage
$336,728
Interest Rate
6.76%
Mortgage Type
New Conventional
Create a Home Valuation Report for This Property
The Home Valuation Report is an in-depth analysis detailing your home's value as well as a comparison with similar homes in the area
Home Values in the Area
Average Home Value in this Area
Purchase History
| Date | Buyer | Sale Price | Title Company |
|---|---|---|---|
| Sunner Sukhwinder S | $320,000 | Chicago Title | |
| Federal National Mortgage Association | $362,478 | None Available | |
| Murray Scott M | $420,911 | Chicago Title |
Source: Public Records
Mortgage History
| Date | Status | Borrower | Loan Amount |
|---|---|---|---|
| Open | Sunner Sukhwinder S | $315,748 | |
| Previous Owner | Murray Scott M | $336,728 |
Source: Public Records
Tax History
| Year | Tax Paid | Tax Assessment Tax Assessment Total Assessment is a certain percentage of the fair market value that is determined by local assessors to be the total taxable value of land and additions on the property. | Land | Improvement |
|---|---|---|---|---|
| 2026 | $5,951 | $779,500 | $470,300 | $309,200 |
| 2025 | $5,594 | $703,200 | $406,100 | $297,100 |
| 2024 | $5,594 | $658,700 | $371,900 | $286,800 |
| 2023 | $6,178 | $798,300 | $468,400 | $329,900 |
| 2022 | $5,824 | $607,900 | $327,800 | $280,100 |
| 2020 | $4,973 | $480,100 | $223,700 | $256,400 |
| 2019 | $4,402 | $439,700 | $185,700 | $254,000 |
| 2018 | $3,997 | $384,100 | $157,500 | $226,600 |
| 2017 | $3,391 | $328,600 | $115,500 | $213,100 |
| 2016 | $3,127 | $313,100 | $109,000 | $204,100 |
| 2015 | $2,987 | $283,300 | $98,500 | $184,800 |
| 2013 | $2,762 | $230,500 | $84,800 | $145,700 |
Source: Public Records
Map
Nearby Homes
- 917 228th St SE
- 22621 8th Dr SE
- 19924 7th Dr SE
- 20021 7th Dr SE
- 20027 7th Dr SE
- 23022 7th Ave SE
- 23115 15th Ave SE Unit D1
- 23431 9th Ave SE Unit 30
- 24330 13 Ave SE Unit CR13
- 24318 13 Ave SE Unit 10
- 24322 13 Ave SE Unit 11
- 100 228th St SE Unit 19B
- 24319 13 Ave SE Unit CR21
- 23510 14th Dr SE
- 815 236th St SE Unit C
- 815 236th St SE Unit F
- 815 236th St SE Unit E
- 815 236th St SE Unit B
- 815 236th St SE Unit D
- 815 236th St SE Unit A
Your Personal Tour Guide
Ask me questions while you tour the home.