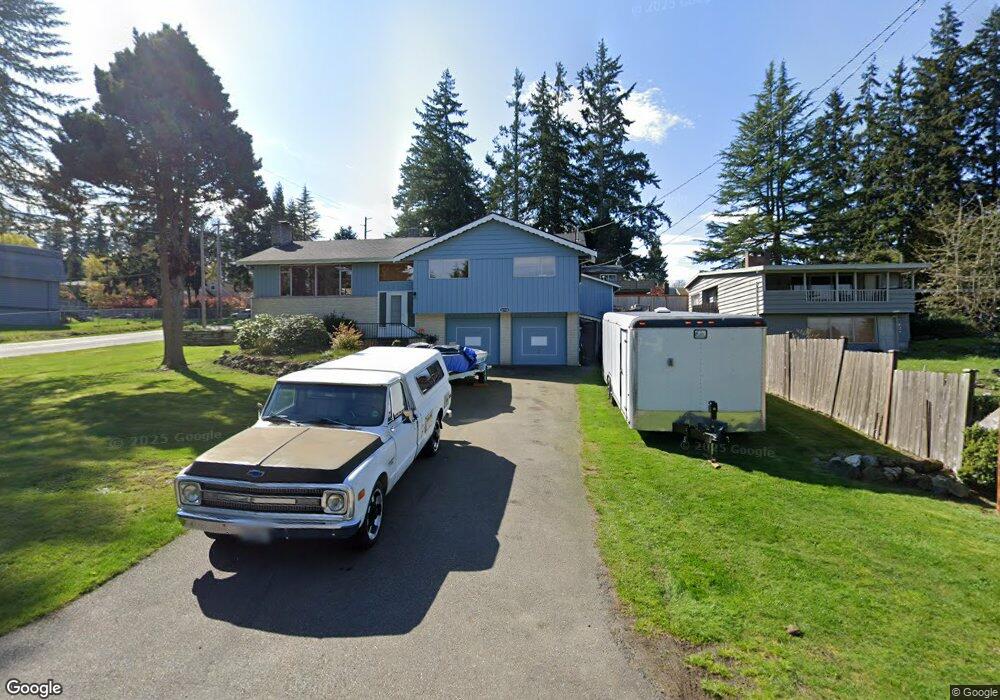
22728 80th Ave W Edmonds, WA 98026
Chase Lake NeighborhoodEstimated Value: $848,588 - $939,000
3
Beds
3
Baths
1,968
Sq Ft
$456/Sq Ft
Est. Value
About This Home
This home is located at 22728 80th Ave W, Edmonds, WA 98026 and is currently estimated at $896,897, approximately $455 per square foot. 22728 80th Ave W is a home located in Snohomish County with nearby schools including Westgate Elementary School, College Place Middle School, and Edmonds-Woodway High School.
Ownership History
Date
Name
Owned For
Owner Type
Purchase Details
Closed on
Dec 12, 2020
Sold by
Sanders Cynthia
Bought by
Sanders Dean and Sanders Cynthia
Current Estimated Value
Home Financials for this Owner
Home Financials are based on the most recent Mortgage that was taken out on this home.
Original Mortgage
$141,169
Outstanding Balance
$125,683
Interest Rate
2.7%
Mortgage Type
Stand Alone Refi Refinance Of Original Loan
Estimated Equity
$771,214
Purchase Details
Closed on
Dec 11, 2020
Sold by
Platt John Emerson and Estate Of Katherine J Hammons
Bought by
Sanders Cynthia
Home Financials for this Owner
Home Financials are based on the most recent Mortgage that was taken out on this home.
Original Mortgage
$141,169
Outstanding Balance
$125,683
Interest Rate
2.7%
Mortgage Type
Stand Alone Refi Refinance Of Original Loan
Estimated Equity
$771,214
Purchase Details
Closed on
Feb 21, 2003
Sold by
Estate Of Paul H Hammons and Hammons Katherine J
Bought by
Hammons Katherine J
Create a Home Valuation Report for This Property
The Home Valuation Report is an in-depth analysis detailing your home's value as well as a comparison with similar homes in the area
Home Values in the Area
Average Home Value in this Area
Purchase History
| Date | Buyer | Sale Price | Title Company |
|---|---|---|---|
| Sanders Dean | -- | Stewart Title | |
| Sanders Cynthia | $141,170 | None Available | |
| Hammons Katherine J | -- | -- |
Source: Public Records
Mortgage History
| Date | Status | Borrower | Loan Amount |
|---|---|---|---|
| Open | Sanders Dean | $141,169 |
Source: Public Records
Tax History Compared to Growth
Tax History
| Year | Tax Paid | Tax Assessment Tax Assessment Total Assessment is a certain percentage of the fair market value that is determined by local assessors to be the total taxable value of land and additions on the property. | Land | Improvement |
|---|---|---|---|---|
| 2025 | $6,141 | $773,700 | $558,900 | $214,800 |
| 2024 | $6,141 | $737,700 | $522,900 | $214,800 |
| 2023 | $6,133 | $769,600 | $545,400 | $224,200 |
| 2022 | $5,932 | $606,700 | $432,100 | $174,600 |
| 2020 | $5,655 | $512,200 | $338,800 | $173,400 |
| 2019 | $5,312 | $478,700 | $310,600 | $168,100 |
| 2018 | $5,269 | $418,400 | $265,800 | $152,600 |
| 2017 | $4,471 | $367,000 | $229,700 | $137,300 |
| 2016 | $4,108 | $338,000 | $203,300 | $134,700 |
| 2015 | $4,198 | $328,600 | $200,600 | $128,000 |
| 2013 | $3,352 | $247,900 | $129,400 | $118,500 |
Source: Public Records
Map
Nearby Homes
- 7818 228th St SW Unit 106
- 22604 78th Ave W
- 23116 80th Place W
- 8012 222nd St SW
- 8017 234th St SW Unit 325
- 7628 222nd St SW Unit B4
- 7923 220th St SW
- 7317 224th St SW Unit A4
- 7205 224th St SW Unit M6
- 8825 231st Place SW
- 8614 Madrona Ln
- 7909 218th St SW Unit 4
- 23727 80th Ct W
- 23015 Edmonds Way Unit A103
- 23001 Lakeview Dr Unit I103
- 22910 90th Ave W Unit C306
- 23121 Edmonds Way Unit 2
- 7522 221st St SW
- 8615 238th St SW Unit B101
- 23227 92nd Ave W
- 8008 228th St SW
- 22716 80th Ave W
- 8021 228th St SW
- 22808 80th Ave W Unit 1
- 22808 80th Ave W Unit 22808
- 22807 80th Place W Unit A
- 22807 80th Place W Unit B
- 22807 80th Place W
- 7927 228th St SW
- 22712 80th Ave W
- 22814 80th Ave W Unit 2
- 22814 80th Ave W Unit 22814
- 8023 228th St SW
- 8029 228th St SW
- 7928 227th Place SW
- 7921 228th St SW
- 22820 80th Ave W
- 22815 80th Place W
- 22815 80th Place W Unit A
- 8032 228th St SW