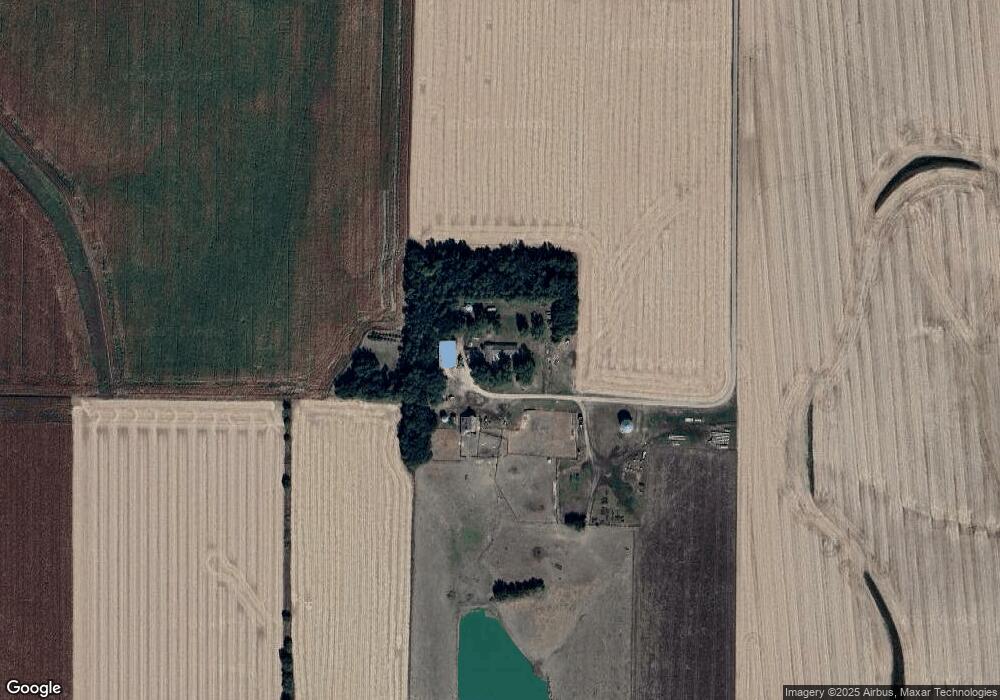
2273 D Rd West Point, NE 68788
Estimated Value: $416,000 - $764,404
3
Beds
2
Baths
2,208
Sq Ft
$267/Sq Ft
Est. Value
About This Home
This home is located at 2273 D Rd, West Point, NE 68788 and is currently estimated at $590,202, approximately $267 per square foot. 2273 D Rd is a home located in Cuming County with nearby schools including West Point-Beemer Junior/Senior High School.
Ownership History
Date
Name
Owned For
Owner Type
Purchase Details
Closed on
Mar 7, 2007
Sold by
Drieling Burnell J and Drieling Rita
Bought by
Drieling Edward M and Drieling Catherine A
Current Estimated Value
Home Financials for this Owner
Home Financials are based on the most recent Mortgage that was taken out on this home.
Original Mortgage
$165,855
Interest Rate
6.26%
Mortgage Type
Future Advance Clause Open End Mortgage
Create a Home Valuation Report for This Property
The Home Valuation Report is an in-depth analysis detailing your home's value as well as a comparison with similar homes in the area
Home Values in the Area
Average Home Value in this Area
Purchase History
| Date | Buyer | Sale Price | Title Company |
|---|---|---|---|
| Drieling Edward M | -- | -- |
Source: Public Records
Mortgage History
| Date | Status | Borrower | Loan Amount |
|---|---|---|---|
| Closed | Drieling Edward M | $165,855 |
Source: Public Records
Tax History Compared to Growth
Tax History
| Year | Tax Paid | Tax Assessment Tax Assessment Total Assessment is a certain percentage of the fair market value that is determined by local assessors to be the total taxable value of land and additions on the property. | Land | Improvement |
|---|---|---|---|---|
| 2025 | $6,326 | $1,115,890 | $890,815 | $225,075 |
| 2024 | $6,326 | $960,165 | $767,915 | $192,250 |
| 2023 | $8,434 | $869,660 | $685,005 | $184,655 |
| 2022 | $7,964 | $809,210 | $657,065 | $152,145 |
| 2021 | $8,430 | $846,525 | $707,330 | $139,195 |
| 2020 | $8,738 | $889,350 | $766,225 | $123,125 |
| 2019 | $8,805 | $878,325 | $767,455 | $110,870 |
| 2018 | $9,064 | $913,250 | $802,380 | $110,870 |
| 2017 | $8,482 | $828,710 | $725,425 | $103,285 |
| 2016 | $8,287 | $766,475 | $673,040 | $93,435 |
| 2015 | $8,305 | $708,935 | $615,500 | $93,435 |
| 2014 | $5,933 | $584,005 | $517,415 | $66,590 |
| 2013 | $5,933 | $427,815 | $360,450 | $67,365 |
Source: Public Records
Map
Nearby Homes
- 2416 F Rd
- 1225 Co Road 1
- 1045 E Grove St
- 126 E Grove St
- 626 S Monitor St
- 749 E Grove St
- TBD Oakland
- 420 S Farragut St
- 519 S Niphon St
- 205 E Sheridan St
- 1402 E Bridge St
- 301 W Pine St
- 402 W Pine St
- 208 N Lincoln St
- 101 S Main St
- 2235 K Rd
- 1207 N Main St
- 108 N Thomas Ave
- 206 N Thomas Ave
- 328 N Oakland Ave