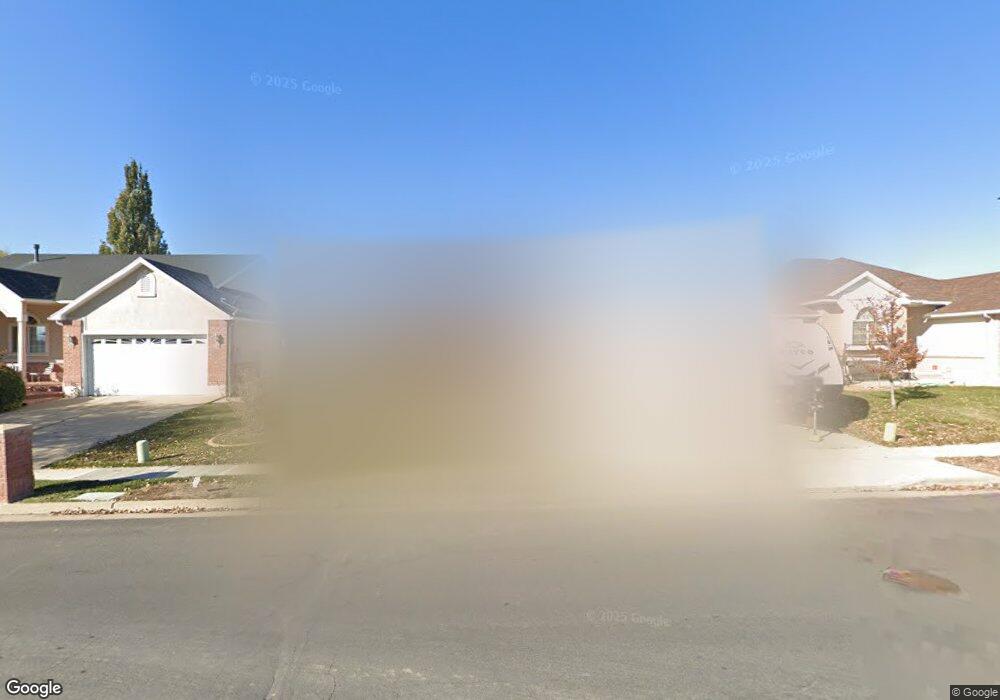
2273 N 800 W Layton, UT 84041
Estimated Value: $505,000 - $548,000
5
Beds
3
Baths
3,076
Sq Ft
$171/Sq Ft
Est. Value
About This Home
This home is located at 2273 N 800 W, Layton, UT 84041 and is currently estimated at $526,574, approximately $171 per square foot. 2273 N 800 W is a home located in Davis County with nearby schools including Lincoln Elementary School, North Layton Junior High School, and Northridge High School.
Ownership History
Date
Name
Owned For
Owner Type
Purchase Details
Closed on
Mar 31, 2010
Sold by
Paakanen Ronald W and Paakanen Cathy A
Bought by
Mace Lisa M
Current Estimated Value
Home Financials for this Owner
Home Financials are based on the most recent Mortgage that was taken out on this home.
Original Mortgage
$247,920
Outstanding Balance
$164,138
Interest Rate
4.88%
Mortgage Type
VA
Estimated Equity
$362,436
Purchase Details
Closed on
Jul 12, 2002
Sold by
The Genevieve K Sampson Trust and Sampson Genevieve K
Bought by
Paakanen Ronald W and Paakanen Cathy A
Home Financials for this Owner
Home Financials are based on the most recent Mortgage that was taken out on this home.
Original Mortgage
$182,050
Interest Rate
6.71%
Purchase Details
Closed on
Apr 2, 1998
Sold by
Willow Bend Inc
Bought by
Sampson Genevieve K
Create a Home Valuation Report for This Property
The Home Valuation Report is an in-depth analysis detailing your home's value as well as a comparison with similar homes in the area
Home Values in the Area
Average Home Value in this Area
Purchase History
| Date | Buyer | Sale Price | Title Company |
|---|---|---|---|
| Mace Lisa M | -- | First American Title | |
| Paakanen Ronald W | -- | Founders Title Co | |
| Sampson Genevieve K | -- | Mountain View Title & Escrow |
Source: Public Records
Mortgage History
| Date | Status | Borrower | Loan Amount |
|---|---|---|---|
| Open | Mace Lisa M | $247,920 | |
| Previous Owner | Paakanen Ronald W | $182,050 |
Source: Public Records
Tax History Compared to Growth
Tax History
| Year | Tax Paid | Tax Assessment Tax Assessment Total Assessment is a certain percentage of the fair market value that is determined by local assessors to be the total taxable value of land and additions on the property. | Land | Improvement |
|---|---|---|---|---|
| 2024 | -- | $259,600 | $107,626 | $151,974 |
| 2023 | $447 | $475,000 | $133,455 | $341,545 |
| 2022 | $447 | $265,100 | $68,903 | $196,197 |
| 2021 | $0 | $358,000 | $92,417 | $265,583 |
| 2020 | $1,805 | $312,000 | $79,524 | $232,476 |
| 2019 | $1,805 | $296,000 | $77,170 | $218,830 |
| 2018 | $0 | $272,000 | $77,170 | $194,830 |
| 2016 | $1,844 | $135,465 | $23,504 | $111,961 |
| 2015 | $1,766 | $123,145 | $23,504 | $99,641 |
| 2014 | $1,729 | $123,270 | $23,504 | $99,766 |
| 2013 | -- | $117,785 | $20,620 | $97,165 |
Source: Public Records
Map
Nearby Homes
- 2402 N 725 W
- 781 W 2150 N
- 2378 N 675 W
- 2211 N 525 W
- 2187 N 450 W
- 2875 N Hill Field Rd Unit 58
- 2875 N Hill Field Rd Unit 17
- 2875 N Hill Field Rd Unit 62
- 1837 N 440 W
- 2887 N 1175 W
- 709 W Highway 193
- 2600 N Hill Field Rd Unit 4
- 2600 N Hill Field Rd Unit 138
- 65 Sunset Dr
- 63 Sunset Dr
- 2949 N 1175 W
- 1676 Forbes Ave W
- 1094 N Angel St W
- 2500 N Fort Ln Unit 238
- 2500 N Fort Ln Unit 189